Unlock a world of possibilities! Login now and discover the exclusive benefits awaiting you.
- Qlik Community
- :
- All Forums
- :
- QlikView App Dev
- :
- Re: My chart legand not display correctly
- Subscribe to RSS Feed
- Mark Topic as New
- Mark Topic as Read
- Float this Topic for Current User
- Bookmark
- Subscribe
- Mute
- Printer Friendly Page
- Mark as New
- Bookmark
- Subscribe
- Mute
- Subscribe to RSS Feed
- Permalink
- Report Inappropriate Content
My chart legand not display correctly
Hi All
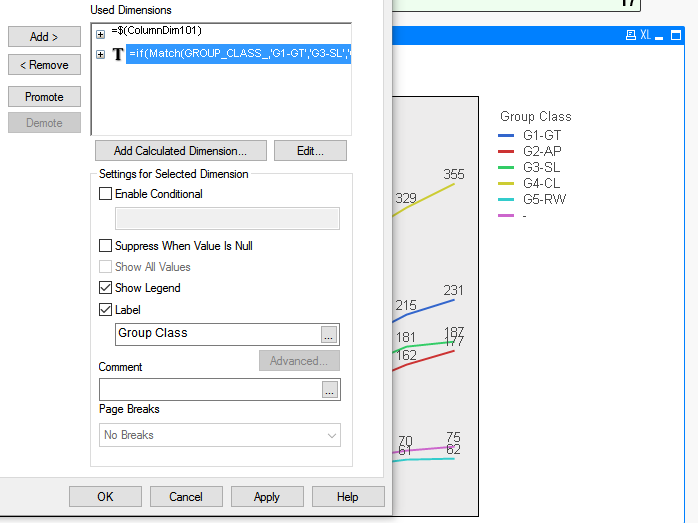
I have a line chart , the legend label is messy , unable to view it clearly.
Because i only want to display , i add the dimension with below script :-
=if(Match(GROUP_CLASS_,
'G1-GT',
'G3-SL',
'G4-CL',
'G5-RW',
'G2-AP')
, GROUP_CLASS_)
Any idea , how to make it look nice ?
Paul
- Tags:
- qlikview_scripting
Accepted Solutions
- Mark as New
- Bookmark
- Subscribe
- Mute
- Subscribe to RSS Feed
- Permalink
- Report Inappropriate Content
Dear Yeo,
it seems because of the Dimension content ( Next Line)
use the below format in Dimension:
=if(Match(GROUP_CLASS_,'G1-GT','G3-SL','G4-CL','G5-RW','G2-AP'),GROUP_CLASS_)
or else
add the dimension label name.
- Mark as New
- Bookmark
- Subscribe
- Mute
- Subscribe to RSS Feed
- Permalink
- Report Inappropriate Content
My QVW !
- Mark as New
- Bookmark
- Subscribe
- Mute
- Subscribe to RSS Feed
- Permalink
- Report Inappropriate Content
Dear Yeo,
it seems because of the Dimension content ( Next Line)
use the below format in Dimension:
=if(Match(GROUP_CLASS_,'G1-GT','G3-SL','G4-CL','G5-RW','G2-AP'),GROUP_CLASS_)
or else
add the dimension label name.
- Mark as New
- Bookmark
- Subscribe
- Mute
- Subscribe to RSS Feed
- Permalink
- Report Inappropriate Content
THANK YOU , IT WORK FINE