Unlock a world of possibilities! Login now and discover the exclusive benefits awaiting you.
- Qlik Community
- :
- All Forums
- :
- QlikView App Dev
- :
- Need Help????
- Subscribe to RSS Feed
- Mark Topic as New
- Mark Topic as Read
- Float this Topic for Current User
- Bookmark
- Subscribe
- Mute
- Printer Friendly Page
- Mark as New
- Bookmark
- Subscribe
- Mute
- Subscribe to RSS Feed
- Permalink
- Report Inappropriate Content
Need Help????
Hi Community,
I have straight table.
Here i want to show 3 columns, but when i am export to excel i need two more columns.
see like this...
Required field's to show..
Name Dept Sal
XYZ IT 10000
ZYV NON-IT 8000
Export to Excel
Name Organization Dept Sal plotform
XYZ ABC IT 10000 Qlikview
ZYV Accenture NON-IT 8000 .Net
Thanks in Advance.......................
- Tags:
- new_to_qlikview
- « Previous Replies
-
- 1
- 2
- Next Replies »
Accepted Solutions
- Mark as New
- Bookmark
- Subscribe
- Mute
- Subscribe to RSS Feed
- Permalink
- Report Inappropriate Content
See my example. You need a macro to solve it. You can see the macro if you press ctrl+M
- Mark as New
- Bookmark
- Subscribe
- Mute
- Subscribe to RSS Feed
- Permalink
- Report Inappropriate Content
this needs to be done in macro, not normal export from QV
- Mark as New
- Bookmark
- Subscribe
- Mute
- Subscribe to RSS Feed
- Permalink
- Report Inappropriate Content
- Mark as New
- Bookmark
- Subscribe
- Mute
- Subscribe to RSS Feed
- Permalink
- Report Inappropriate Content
create a variable (Settings->Variable Overview) name it vShow
give it an initial value of 0
now go to your straight table with the five columns set
now go to properties of your chart
put in the Enable Conditional for the dimension that you want to hide vShow =1
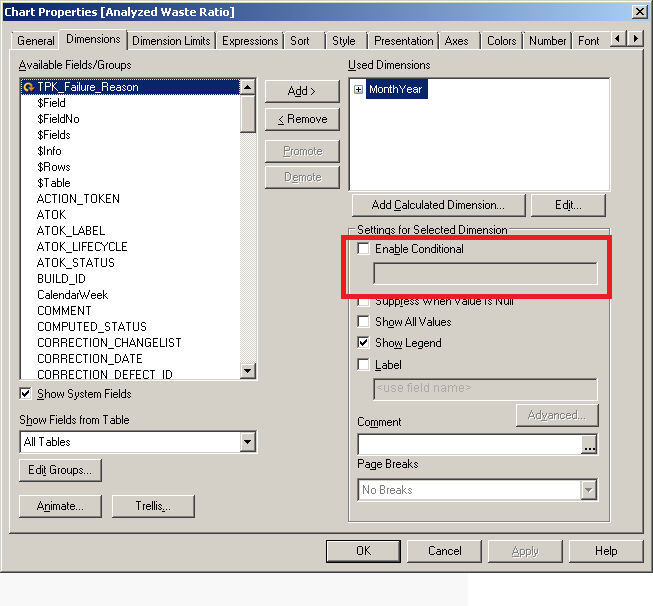
and for the expression that you want to hide put in the check the conditional check box and put vShow=1
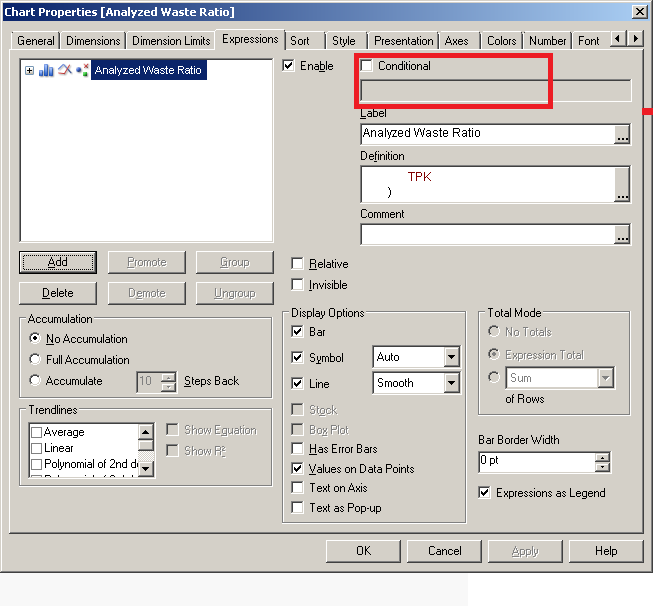
Now that the initial value of the vShow = 0 the designated dimensions and expressions will be hidden
Now add a button and on the actions add an action to run a macro this macro will export your chart to excel as follows:
ActiveDocument.GetVariable("vShow").SetContent 0,true
set XLApp = CreateObject("Excel.Application")
' Makes it run in background
XLApp.Visible = false
XLApp.DisplayAlerts = false
Set fso = CreateObject("Scripting.FileSystemObject")
If (fso.FileExists(put_the_path of the excel file here)) Then
Set XLDoc = XLApp.Workbooks.Open (path to excel file)
Else
set XLDoc = XLApp.Workbooks.Add()
' Save the excel-file with the dynamic path and filename
XLDoc.SaveAs path_to_excel
End If
ActiveDocument.GetSheetObject("id of your chart").CopyTableToClipboard true
XLDoc.Sheets(1).Paste()
XLDoc.Sheets(1).Rows("1:3000").EntireRow.AutoFit
' Save the excel-file with the dynamic path and filename
XLDoc.SaveAs QcRegressionExcelFilePath
' Exits the current running Excel
XLApp.Quit
ActiveDocument.GetVariable("vShow").SetContent 1,true
- Mark as New
- Bookmark
- Subscribe
- Mute
- Subscribe to RSS Feed
- Permalink
- Report Inappropriate Content
Hi,
With single table it is not possible, create two charts with Name, Dept, Sal in one chart and another with additional columns, create a button and assign a macro this.
Hide the chart with details and use this chart in macro to export to excel.
Regards,
jagan.
- Mark as New
- Bookmark
- Subscribe
- Mute
- Subscribe to RSS Feed
- Permalink
- Report Inappropriate Content
HI,
May be like this
Regards
ASHFAQ
- Mark as New
- Bookmark
- Subscribe
- Mute
- Subscribe to RSS Feed
- Permalink
- Report Inappropriate Content
you can hide some columns in any table!!
- Mark as New
- Bookmark
- Subscribe
- Mute
- Subscribe to RSS Feed
- Permalink
- Report Inappropriate Content
anyone have sample application.....
- Mark as New
- Bookmark
- Subscribe
- Mute
- Subscribe to RSS Feed
- Permalink
- Report Inappropriate Content
Did you check my application?
Regards
ASHFAQ
- Mark as New
- Bookmark
- Subscribe
- Mute
- Subscribe to RSS Feed
- Permalink
- Report Inappropriate Content
See my example. You need a macro to solve it. You can see the macro if you press ctrl+M
- « Previous Replies
-
- 1
- 2
- Next Replies »