Unlock a world of possibilities! Login now and discover the exclusive benefits awaiting you.
- Qlik Community
- :
- All Forums
- :
- QlikView App Dev
- :
- Need help
- Subscribe to RSS Feed
- Mark Topic as New
- Mark Topic as Read
- Float this Topic for Current User
- Bookmark
- Subscribe
- Mute
- Printer Friendly Page
- Mark as New
- Bookmark
- Subscribe
- Mute
- Subscribe to RSS Feed
- Permalink
- Report Inappropriate Content
Need help
Hi All,
My requirement is as below
I have a review done by for each resources by Internal and External for few categoires. The resources are rated based on each Category on a scale of 1 to 10. if rating value is NA which means the resource has not been rated for that category and should not be considerd for calculation. For example Name1 has been rated for 3 Categories
Condition 1: The resources would be considered as Excellent by Internal if only rating for all the categories for which he is rated is >7
Condition 2: The resources would be considered as Excellent by External if only rating for all the categories for which he is rated is >7
If the resource is EXCELLENT in both Internal and Extrenal over all valid Categories , Then the resource will be considered as Overall Excellent
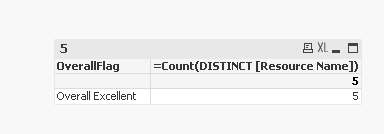
I just want to create a chart which will tell me total no of resources and how many of them has overall as Excellent . The chart should have 3 columns
Any dimension , Total No of Resources for that dimension and Total no of Overall Excellent Resouces. I have attached a sample data for the reference
Accepted Solutions
- Mark as New
- Bookmark
- Subscribe
- Mute
- Subscribe to RSS Feed
- Permalink
- Report Inappropriate Content
- Mark as New
- Bookmark
- Subscribe
- Mute
- Subscribe to RSS Feed
- Permalink
- Report Inappropriate Content
May be like this?