Unlock a world of possibilities! Login now and discover the exclusive benefits awaiting you.
- Qlik Community
- :
- All Forums
- :
- QlikView App Dev
- :
- Re: Need to Show Minor Grid line
- Subscribe to RSS Feed
- Mark Topic as New
- Mark Topic as Read
- Float this Topic for Current User
- Bookmark
- Subscribe
- Mute
- Printer Friendly Page
- Mark as New
- Bookmark
- Subscribe
- Mute
- Subscribe to RSS Feed
- Permalink
- Report Inappropriate Content
Need to Show Minor Grid line
Hi All,
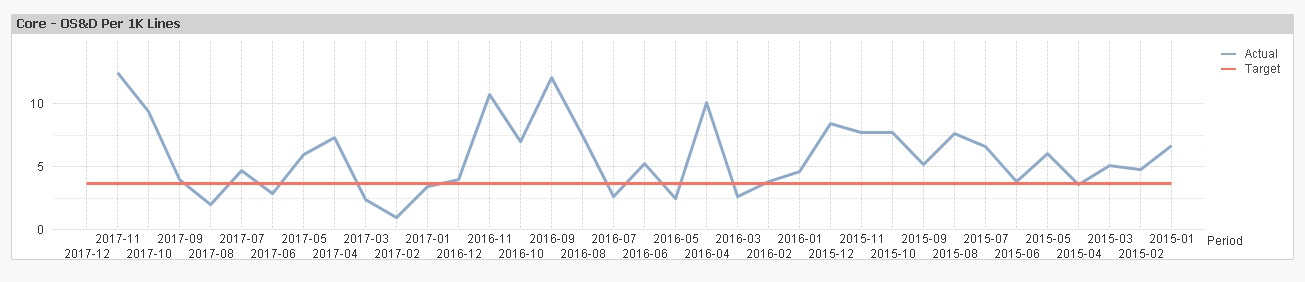
I have a line chart like below.

Is it possible to show minor grid line between Major grid line (0,5,10). Minor should show 1,2,3,4.
And Major grid line would be darker and minor would be lighter.
Please help.
Thanks,
Sarif
- Mark as New
- Bookmark
- Subscribe
- Mute
- Subscribe to RSS Feed
- Permalink
- Report Inappropriate Content
use reference lines (tab presentaton)

- Mark as New
- Bookmark
- Subscribe
- Mute
- Subscribe to RSS Feed
- Permalink
- Report Inappropriate Content
Sarif
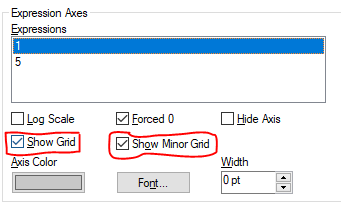
On the Axes tab for the chart properties check the Show Minor Grid box for Expression Axis
Regards
Adrian
- Mark as New
- Bookmark
- Subscribe
- Mute
- Subscribe to RSS Feed
- Permalink
- Report Inappropriate Content
I have already tried that. It is showing the minor axis, but not showing the value. We need the the in between values also.
Thanks,
Sarif
- Mark as New
- Bookmark
- Subscribe
- Mute
- Subscribe to RSS Feed
- Permalink
- Report Inappropriate Content
May be this?
- Mark as New
- Bookmark
- Subscribe
- Mute
- Subscribe to RSS Feed
- Permalink
- Report Inappropriate Content
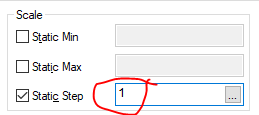
Manually updated the below in Axes tab
Chart Static Step = 1
and check show Minor Grid
If a post helps to resolve your issue, please accept it as a Solution.
- Mark as New
- Bookmark
- Subscribe
- Mute
- Subscribe to RSS Feed
- Permalink
- Report Inappropriate Content
I Tried that, Grid is coming but not values.
Coming like this.
- Mark as New
- Bookmark
- Subscribe
- Mute
- Subscribe to RSS Feed
- Permalink
- Report Inappropriate Content
Not working sir.
- Mark as New
- Bookmark
- Subscribe
- Mute
- Subscribe to RSS Feed
- Permalink
- Report Inappropriate Content
Try this? If you need to start from 1/0 to end using Static step. you can manipulate Min and Max if needed