Unlock a world of possibilities! Login now and discover the exclusive benefits awaiting you.
- Qlik Community
- :
- All Forums
- :
- QlikView App Dev
- :
- Need to display data points on line chart
- Subscribe to RSS Feed
- Mark Topic as New
- Mark Topic as Read
- Float this Topic for Current User
- Bookmark
- Subscribe
- Mute
- Printer Friendly Page
- Mark as New
- Bookmark
- Subscribe
- Mute
- Subscribe to RSS Feed
- Permalink
- Report Inappropriate Content
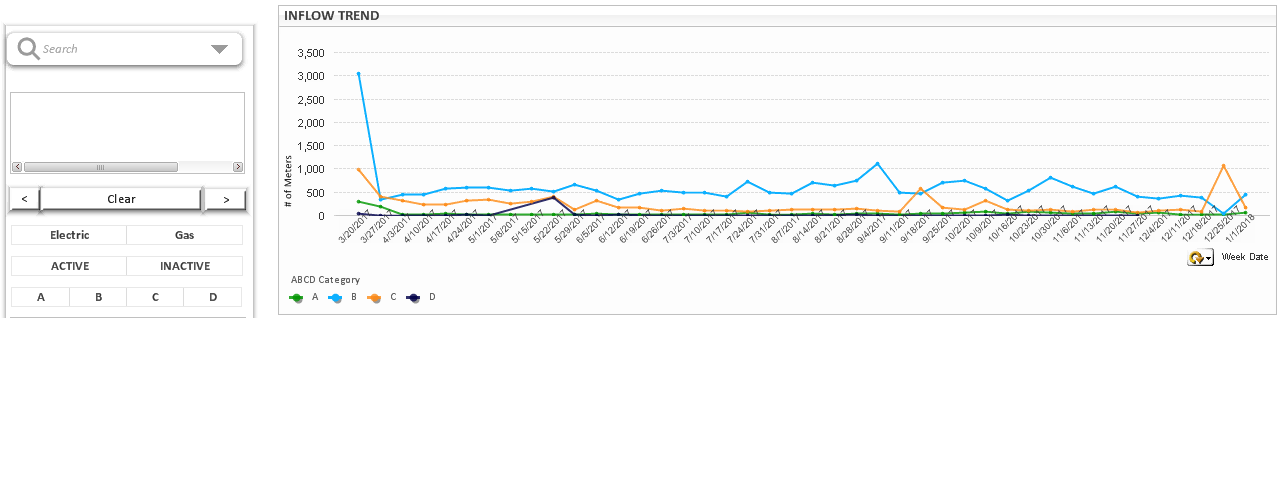
Need to display data points on line chart
Friends,
I have created line chart to show count of 'ABCD' for whole week. Data point is not visible in line chart by default. but when i select any category'ABCD' like A, it shows data point as attached in the below screenshot.Kindly share your knowledge.
before:
after selecting A :

It would be very useful if anybody share your knowledge.
Accepted Solutions
- Mark as New
- Bookmark
- Subscribe
- Mute
- Subscribe to RSS Feed
- Permalink
- Report Inappropriate Content
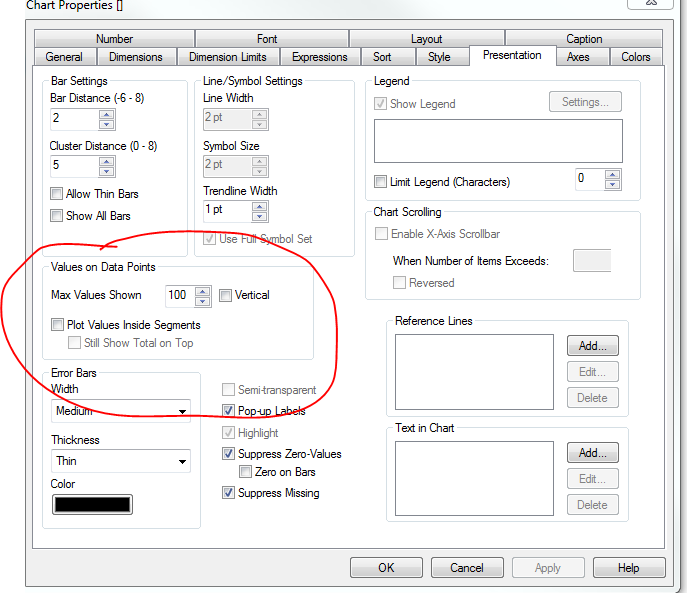
Make sure you set a high number for Values on Data Points.. may be like 500 something
- Mark as New
- Bookmark
- Subscribe
- Mute
- Subscribe to RSS Feed
- Permalink
- Report Inappropriate Content
I can think only one which condition may written like, Expand your measure there you will get "Set Value" section. From there i can think like If(GetFieldSelection(FieldName)>0, 1,0)
- Mark as New
- Bookmark
- Subscribe
- Mute
- Subscribe to RSS Feed
- Permalink
- Report Inappropriate Content
Make sure you set a high number for Values on Data Points.. may be like 500 something
- Mark as New
- Bookmark
- Subscribe
- Mute
- Subscribe to RSS Feed
- Permalink
- Report Inappropriate Content
Thank you Sunny. exactly what i want.its working as expected.