Unlock a world of possibilities! Login now and discover the exclusive benefits awaiting you.
- Qlik Community
- :
- All Forums
- :
- QlikView App Dev
- :
- Need to display negative values of Bar chart in st...
- Subscribe to RSS Feed
- Mark Topic as New
- Mark Topic as Read
- Float this Topic for Current User
- Bookmark
- Subscribe
- Mute
- Printer Friendly Page
- Mark as New
- Bookmark
- Subscribe
- Mute
- Subscribe to RSS Feed
- Permalink
- Report Inappropriate Content
Need to display negative values of Bar chart in staright table(Web Mode)
Hi Qlikview Experts,
I'm trying to display positive and negative bars in straight table(Using Linear Gauge).
Its coming fine in Qlikview Desktop,
But in web mode ,alignment is not fine as expected.
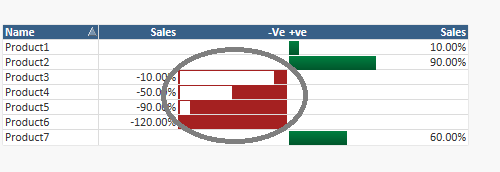
Some red lined outline is coming on negative bar chart.
In Web mode:
In Normal Mode:

Data Used in Script:
LOAD * INLINE [
Name, Sales
Product1, 10%
Product2, 90%
Product3, -10%
Product4, -50%
Product5, -90%
Product6, -120%
Product7, 60%
];
Dimension used in straight table is Name
Expressions used are 4 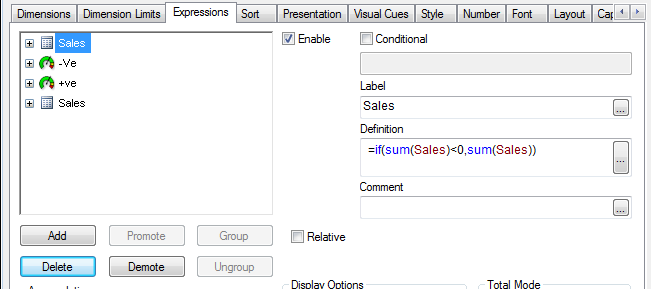
1st Exp:=if(sum(Sales)<0,sum(Sales))
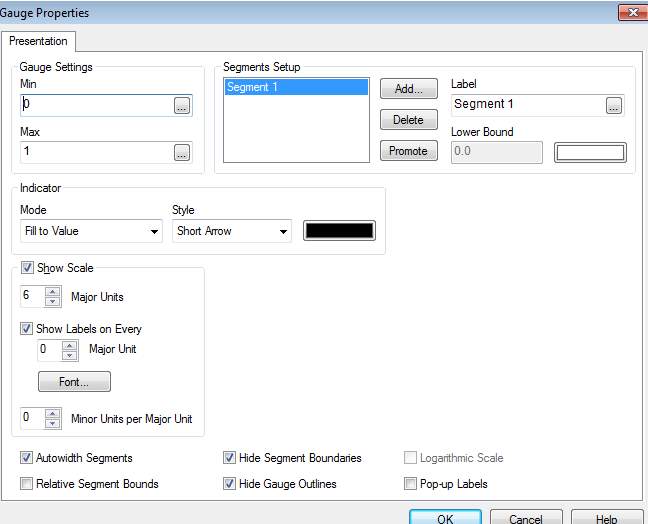
2nd Exp: =if(sum(Sales)<0,1+sum(Sales)) (Linear Gauge)
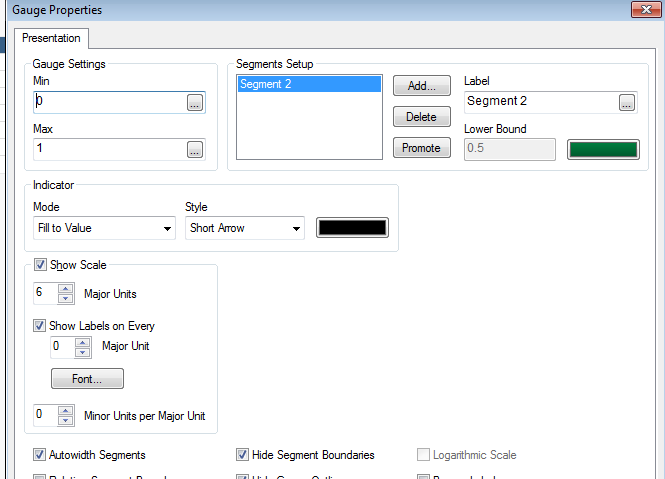
Gauge settings:
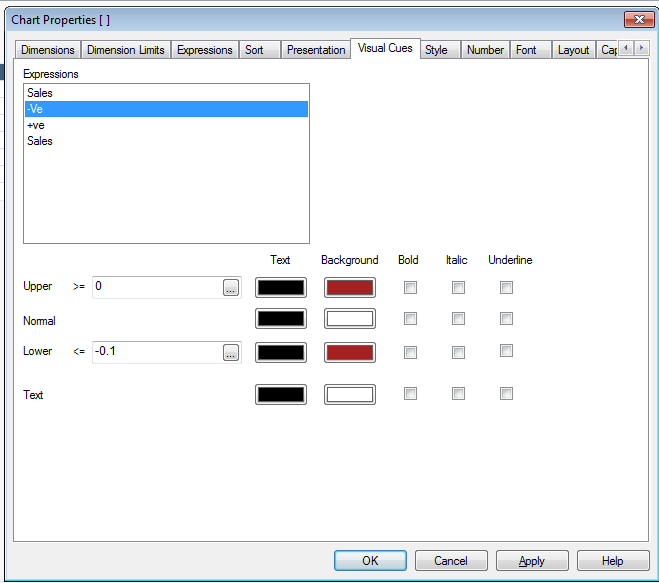
Visual Clue settings:
3rd Exp:=if(sum(Sales)>0,sum(Sales)) (Linear Gauge)
4th Exp: =if(sum(Sales)>0,sum(Sales))
- Mark as New
- Bookmark
- Subscribe
- Mute
- Subscribe to RSS Feed
- Permalink
- Report Inappropriate Content
It's a bug, I think..
- Mark as New
- Bookmark
- Subscribe
- Mute
- Subscribe to RSS Feed
- Permalink
- Report Inappropriate Content
Same issue is replicating in the given link also.
