Unlock a world of possibilities! Login now and discover the exclusive benefits awaiting you.
- Qlik Community
- :
- All Forums
- :
- QlikView App Dev
- :
- Need to get the Average on the Selected Date Range
- Subscribe to RSS Feed
- Mark Topic as New
- Mark Topic as Read
- Float this Topic for Current User
- Bookmark
- Subscribe
- Mute
- Printer Friendly Page
- Mark as New
- Bookmark
- Subscribe
- Mute
- Subscribe to RSS Feed
- Permalink
- Report Inappropriate Content
Need to get the Average on the Selected Date Range
Hi All,
I want to get the Average on Yellow as shown in the below Script based on the Month Value Selected.
Data:
| Month | SKU | Pen_Id | Yellow |
| Jul | Corbett X | C5345764 | 0.192 |
| Jul | Corbett X | C5345765 | 0.233 |
| Aug | Gen 3 Pyramid Color - Corbett X | C5346293 | 0.034 |
| Aug | Gen 3 Pyramid Color - Corbett X | C5347022 | 0.191 |
| Aug | Gen 3 Pyramid Color - Corbett X | C5346295 | 0.141 |
| Aug | Gen 3 Pyramid Color - Corbett X | C5347023 | 0.307 |
| Aug | Gen 3 Pyramid Color - Corbett X | C5347020 | 0.143 |
| Aug | Gen 3 Pyramid Color - Corbett X | C5347019 | 0.254 |
| Aug | Gen 3 Pyramid Color - Corbett X | C5347021 | -0.958 |
| Aug | Gen 3 Pyramid Color - Corbett X | C5346294 | 0.099 |
| Aug | Gen 3 Pyramid Color - Corbett X | C5347024 | 0.16 |
| Aug | Gen 3 Pyramid Color - Corbett X | C5346292 | 0.17 |
| Aug | Gen 3 Pyramid Color - Corbett X | C5346296 | 0.136 |
| Sept | Gen 3 Pyramid Color - Corbett X | C5347910 | 0.1 |
| Sept | Gen 3 Pyramid Color - Corbett X | C5347908 | 0.082 |
| Sept | Gen 3 Pyramid Color - Corbett X | C5347904 | 0.265 |
| Sept | Gen 3 Pyramid Color - Corbett X | C5347909 | 0.132 |
| Sept | Gen 3 Pyramid Color - Corbett X | C5347907 | 0.272 |
| Sept | Gen 3 Pyramid Color - Corbett X | C5348461 | 0.092 |
| Sept | Gen 3 Pyramid Color - Corbett X | C5348467 | 0.28 |
| Sept | Gen 3 Pyramid Color - Corbett X | C5348139 | 0 |
| Sept | Gen 3 Pyramid Color - Corbett X | C5347905 | 0.083 |
| Sept | Gen 3 Pyramid Color - Corbett X | C5348141 | 0.161 |
| Sept | Gen 3 Pyramid Color - Corbett X | C5347911 | 0 |
| Sept | Gen 3 Pyramid Color - Corbett X | C5348140 | 0.202 |
| Sept | Gen 3 Pyramid Color - Corbett X | C5348138 | 0.188 |
| Sept | Gen 3 Pyramid Color - Corbett X | C5347906 | 0.062 |
| Sept | Gen 3 Pyramid Color - Corbett X | C5348464 | 0.227 |
Script:
AggregationofYelInks:
LOAD
[Yellow Calculated Ink]as "AvgchartYCI"
Resident CorbettSrc
where Pen_Id <> 'C5347020' ;
Chart Expression given to get the Average of the AvgChartYCI based on the Month Selected. But Getting the Average value of the AvgChartYCI for all the Months , even if we select for only 1 Month -- Jul as seen in the below screenshot:
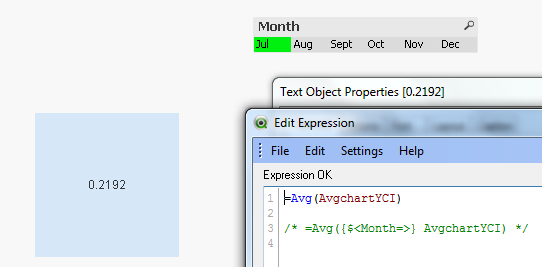
Above shown Text value -- 0.2192 -- is Average value for all the Months. But, The average should come for only the Month -- Jul as selected above.
Could you please help me in getting the Average value for the Selected Months only.
Please send an answer for this post to harvarinf1531@gmail.com
Thanks & Regards,
Harish
- Mark as New
- Bookmark
- Subscribe
- Mute
- Subscribe to RSS Feed
- Permalink
- Report Inappropriate Content
Would you be able to share a sample where we can see the issue? This could be because of the data model, but will be difficult to pin-point without having a look.
Preparing examples for Upload - Reduction and Data Scrambling