Unlock a world of possibilities! Login now and discover the exclusive benefits awaiting you.
- Qlik Community
- :
- All Forums
- :
- QlikView App Dev
- :
- Need to mix False data and Real Data
- Subscribe to RSS Feed
- Mark Topic as New
- Mark Topic as Read
- Float this Topic for Current User
- Bookmark
- Subscribe
- Mute
- Printer Friendly Page
- Mark as New
- Bookmark
- Subscribe
- Mute
- Subscribe to RSS Feed
- Permalink
- Report Inappropriate Content
Need to mix False data and Real Data
Hi All,
I have ticketing data for this year staring from Jan.
I have a requirement to create a bar chart that would have ticket count for all the months.
Months Jan-Current of 2016 can be covered with the data provided.
But i have also been asked to plot the bars for some Months from 2015 (i.e. July to Dec) for which i have been given a direct count only.
Hence, there is no data for Year 2015 months. I only have the ticket count for each month.
How can this be achieved ?
- Mark as New
- Bookmark
- Subscribe
- Mute
- Subscribe to RSS Feed
- Permalink
- Report Inappropriate Content
Use this generatedata.com to generate fake data
- Mark as New
- Bookmark
- Subscribe
- Mute
- Subscribe to RSS Feed
- Permalink
- Report Inappropriate Content
A bit hard to give an exact suggestion without knowing what your data looks like and what your field names are. The answer will depend on how you handle the ticket data when you load the data. You could put all the data in the same field, or you might have it in two different tables. What have you tried?
- Mark as New
- Bookmark
- Subscribe
- Mute
- Subscribe to RSS Feed
- Permalink
- Report Inappropriate Content
Here is an example using sales data:
QlikView Script:
//This will load Sales Data for 2016.
//This will be from your database - just using Excel as an example.
Sales:
LOAD SalesDate,
SalesAmt
FROM
(
//This will append Sales for 2015 to the above 'Sales' table.
Load * inline [
SalesDate, SalesAmt
07/14/2015, 95.00
08/24/2015, 105.00
09/15/2015, 120.00
10/23/2015, 135.00
11/09/2015, 120.00
12/10/2015, 125.00
];
Contents of Sales.xls

QlikView results:
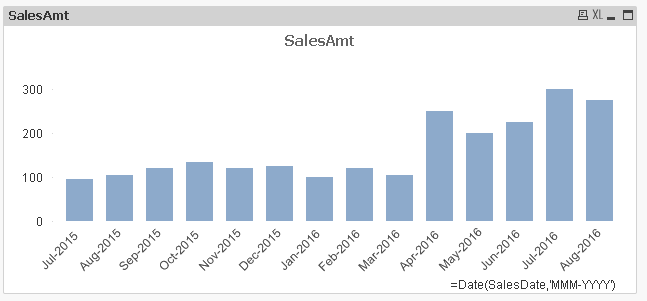
Notice sales for both 2015 and 2016 are merged in the bar chart below:

Is this what you are looking for?
- Stan
- Mark as New
- Bookmark
- Subscribe
- Mute
- Subscribe to RSS Feed
- Permalink
- Report Inappropriate Content
Defining a Inline Load for 2015 Months as you are having total counts and then concatenate with 2016 Month will not solve?
- Mark as New
- Bookmark
- Subscribe
- Mute
- Subscribe to RSS Feed
- Permalink
- Report Inappropriate Content
My example data for 2015 was not the best. You can as many rows as needed for each month. The chart can then Sum it up by Month.
Load * inline [
SalesDate, SalesAmt
07/14/2015, 20.00
07/15/2015, 65.00
07/31/2015, 10.00
08/01/2015, 10.00
08/24/2015, 75.00
08/31/2015, 20.00
09/01/2015, 5.00
09/15/2015, 115.00
10/23/2015, 10.00
10/31/2015, 125
11/09/2015, 20.00
11/12/2015, 100.00
12/10/2015, 120.00
12/25/2015, 5.00
];
The qvw has been attached to make sure we are on the same page.