Unlock a world of possibilities! Login now and discover the exclusive benefits awaiting you.
- Qlik Community
- :
- All Forums
- :
- QlikView App Dev
- :
- Negative Zero on X axis
- Subscribe to RSS Feed
- Mark Topic as New
- Mark Topic as Read
- Float this Topic for Current User
- Bookmark
- Subscribe
- Mute
- Printer Friendly Page
- Mark as New
- Bookmark
- Subscribe
- Mute
- Subscribe to RSS Feed
- Permalink
- Report Inappropriate Content
Negative Zero on X axis
Hi Experts,
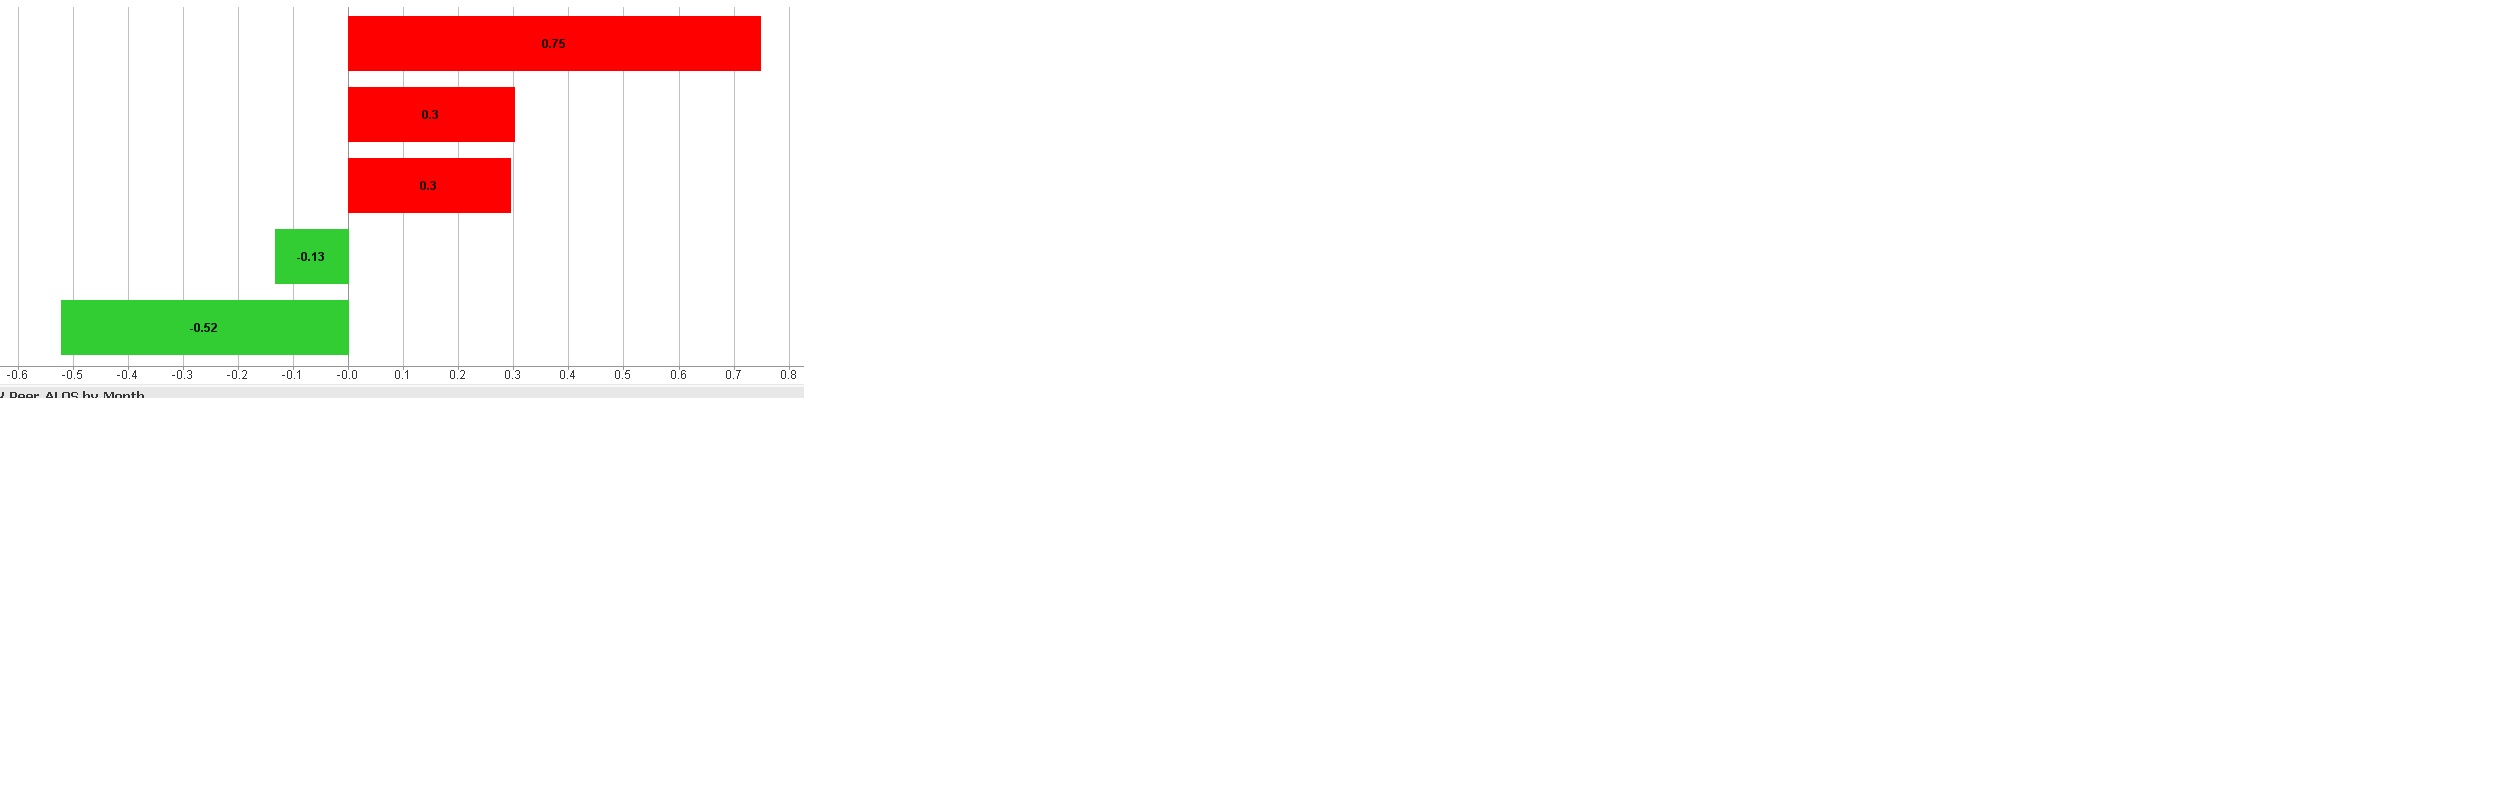
I have a combo chart with a dimension on Y axis and an expression on X axis. The expression resulting negative values including negative zeroes. How come there is a negative zero in the world?
Could you please guide me how to resolve this issue? I just want to see '0.0' on X axis, not '-0.0'.
Thanks and Regards
Mahesh Gadde
- « Previous Replies
-
- 1
- 2
- Next Replies »
- Mark as New
- Bookmark
- Subscribe
- Mute
- Subscribe to RSS Feed
- Permalink
- Report Inappropriate Content
Hi Mahesh,
In your Combo chart, you have any negative value like -0.003 or -0.002 etc when you round of to 2 digit it will give you -0.00 because of that it might be coming.
Check the same.
Or else can you put some data.
Regards,
Neha
- Mark as New
- Bookmark
- Subscribe
- Mute
- Subscribe to RSS Feed
- Permalink
- Report Inappropriate Content
Hi Neha,
Thanks for your prompt response.
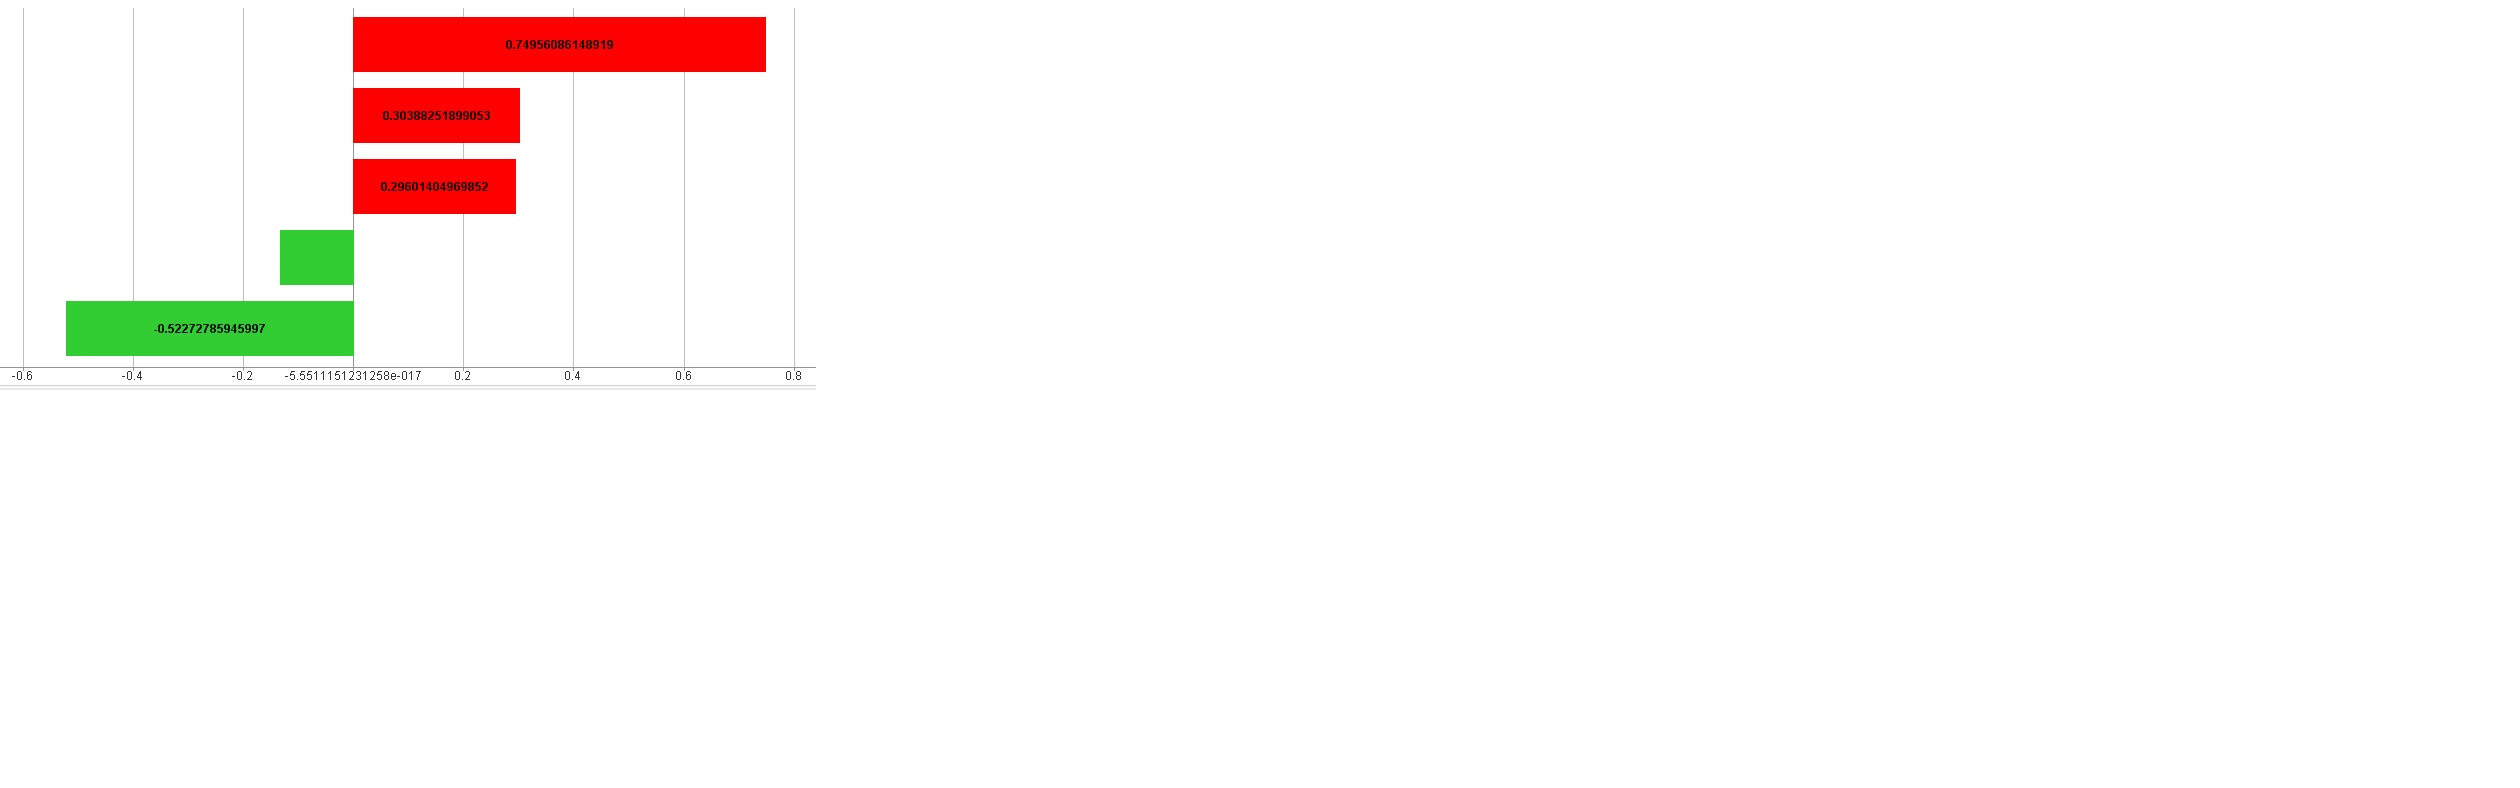
It's not actually '-0.0'. it is actually -5.6e-017. what's the best way to make it to '0'.
I am unable to attach any images for your consideration.
Thanks and Regards
Mahesh Gadde
- Mark as New
- Bookmark
- Subscribe
- Mute
- Subscribe to RSS Feed
- Permalink
- Report Inappropriate Content
May be use
If(Expression <= 0 and Expression >= -1, Ceil(Expression), Expression)
- Mark as New
- Bookmark
- Subscribe
- Mute
- Subscribe to RSS Feed
- Permalink
- Report Inappropriate Content
Hi Sunny,
I tried it already. but no use. My Expression is like 'a/b - c/d'. so it's dynamically changing the x-axis values(especially minimum and maximum on the axis). so nothing is working.
I tried round function like, Round(Expression*100)/100. but no use.
Thanks and Regards
Mahesh Gadde
- Mark as New
- Bookmark
- Subscribe
- Mute
- Subscribe to RSS Feed
- Permalink
- Report Inappropriate Content
If you really round the expression to two decimal places, I think the negative sign will not be shown
=Round(-0.00001,0.01)
should show 0.00
compared to just formatting the expression with two decimal places:
=Num(-0.00001,'0.00')
where you might see the minus sign -0.00
- Mark as New
- Bookmark
- Subscribe
- Mute
- Subscribe to RSS Feed
- Permalink
- Report Inappropriate Content
Could you post a small sample QVW?
Note that Round(Expression*100)/100 might not return the same as what I've suggested above
- Mark as New
- Bookmark
- Subscribe
- Mute
- Subscribe to RSS Feed
- Permalink
- Report Inappropriate Content
Hi Stefan,
Please refer the below images. I don't have rights to post any sample QVW's. Please let me know what to do to getrid of the negative values in x axis?
Thanks and Regards
Mahesh Gadde
- Mark as New
- Bookmark
- Subscribe
- Mute
- Subscribe to RSS Feed
- Permalink
- Report Inappropriate Content
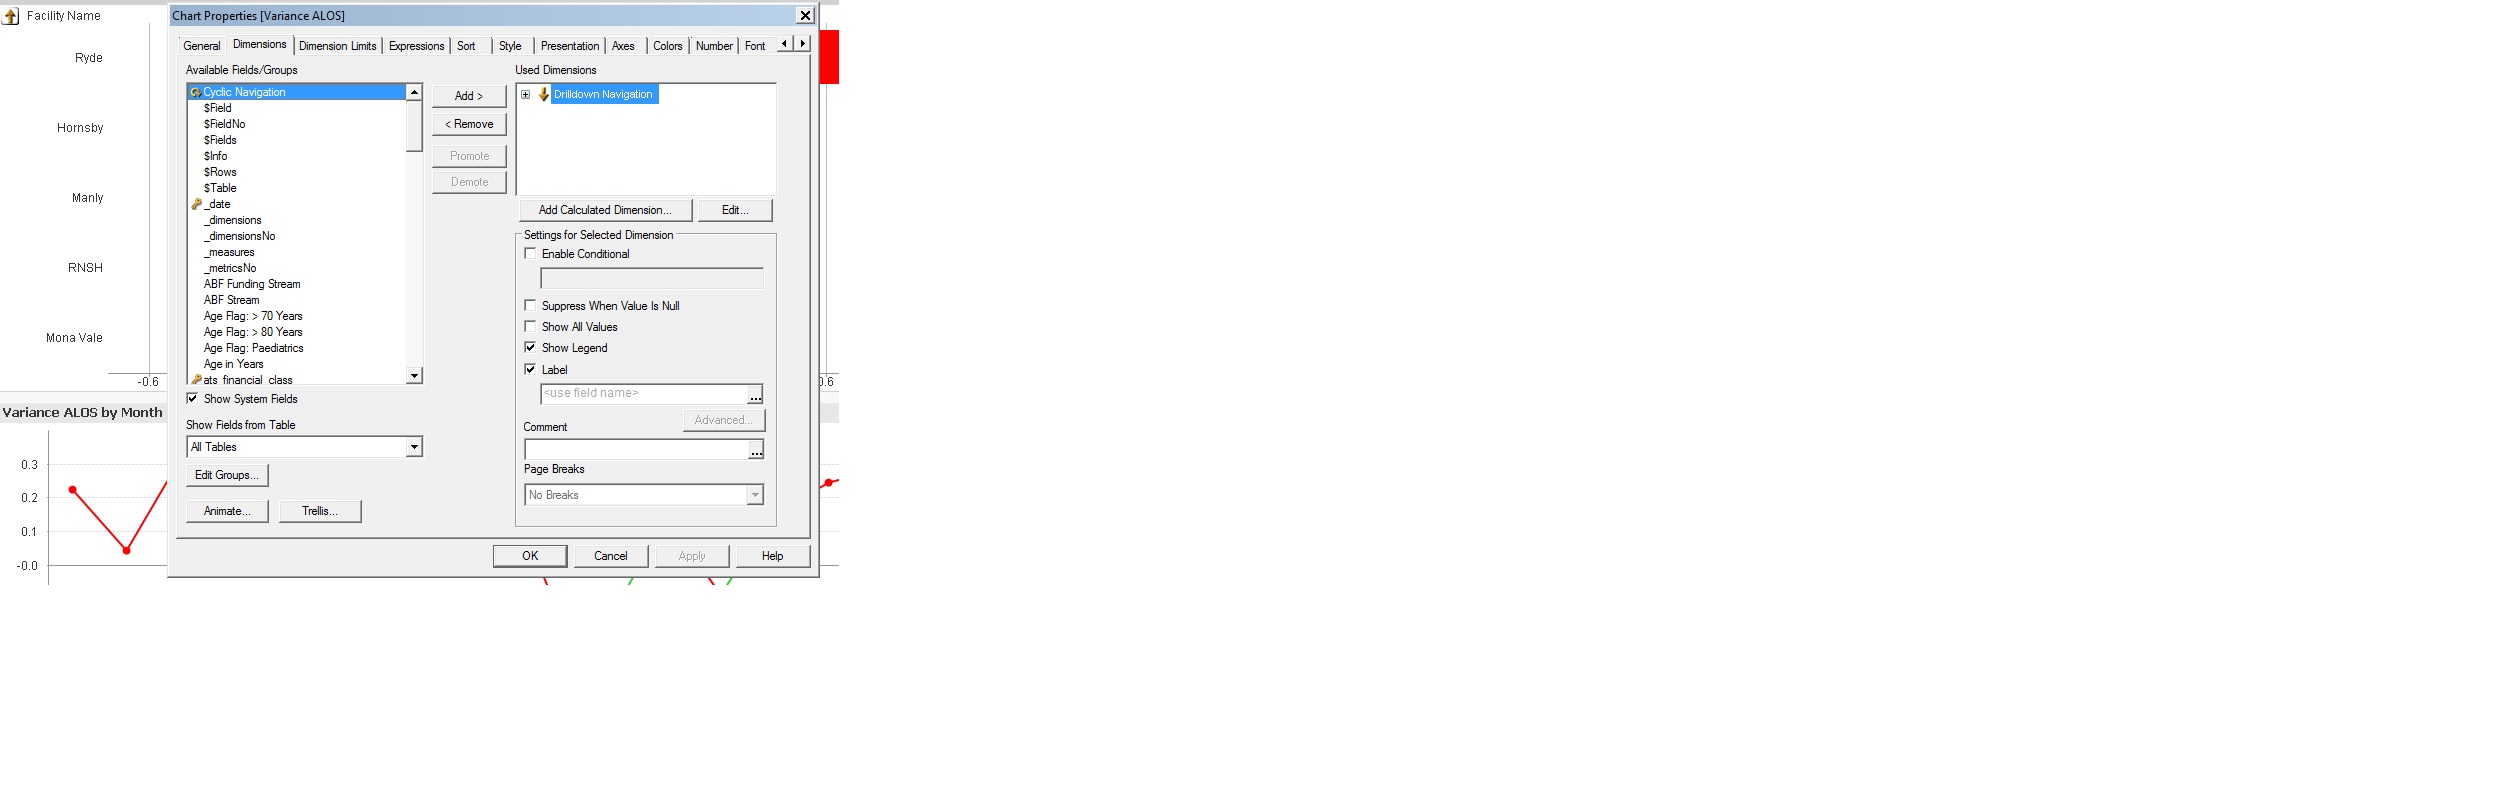
Could you post screenshot from your chart settings tabs? Especially from dimensions, expression, axes and number tab?
- Mark as New
- Bookmark
- Subscribe
- Mute
- Subscribe to RSS Feed
- Permalink
- Report Inappropriate Content
Hi Stefan,
Thanks for your prompt responses.
Here am attaching the screenshots of the tabs you asked for.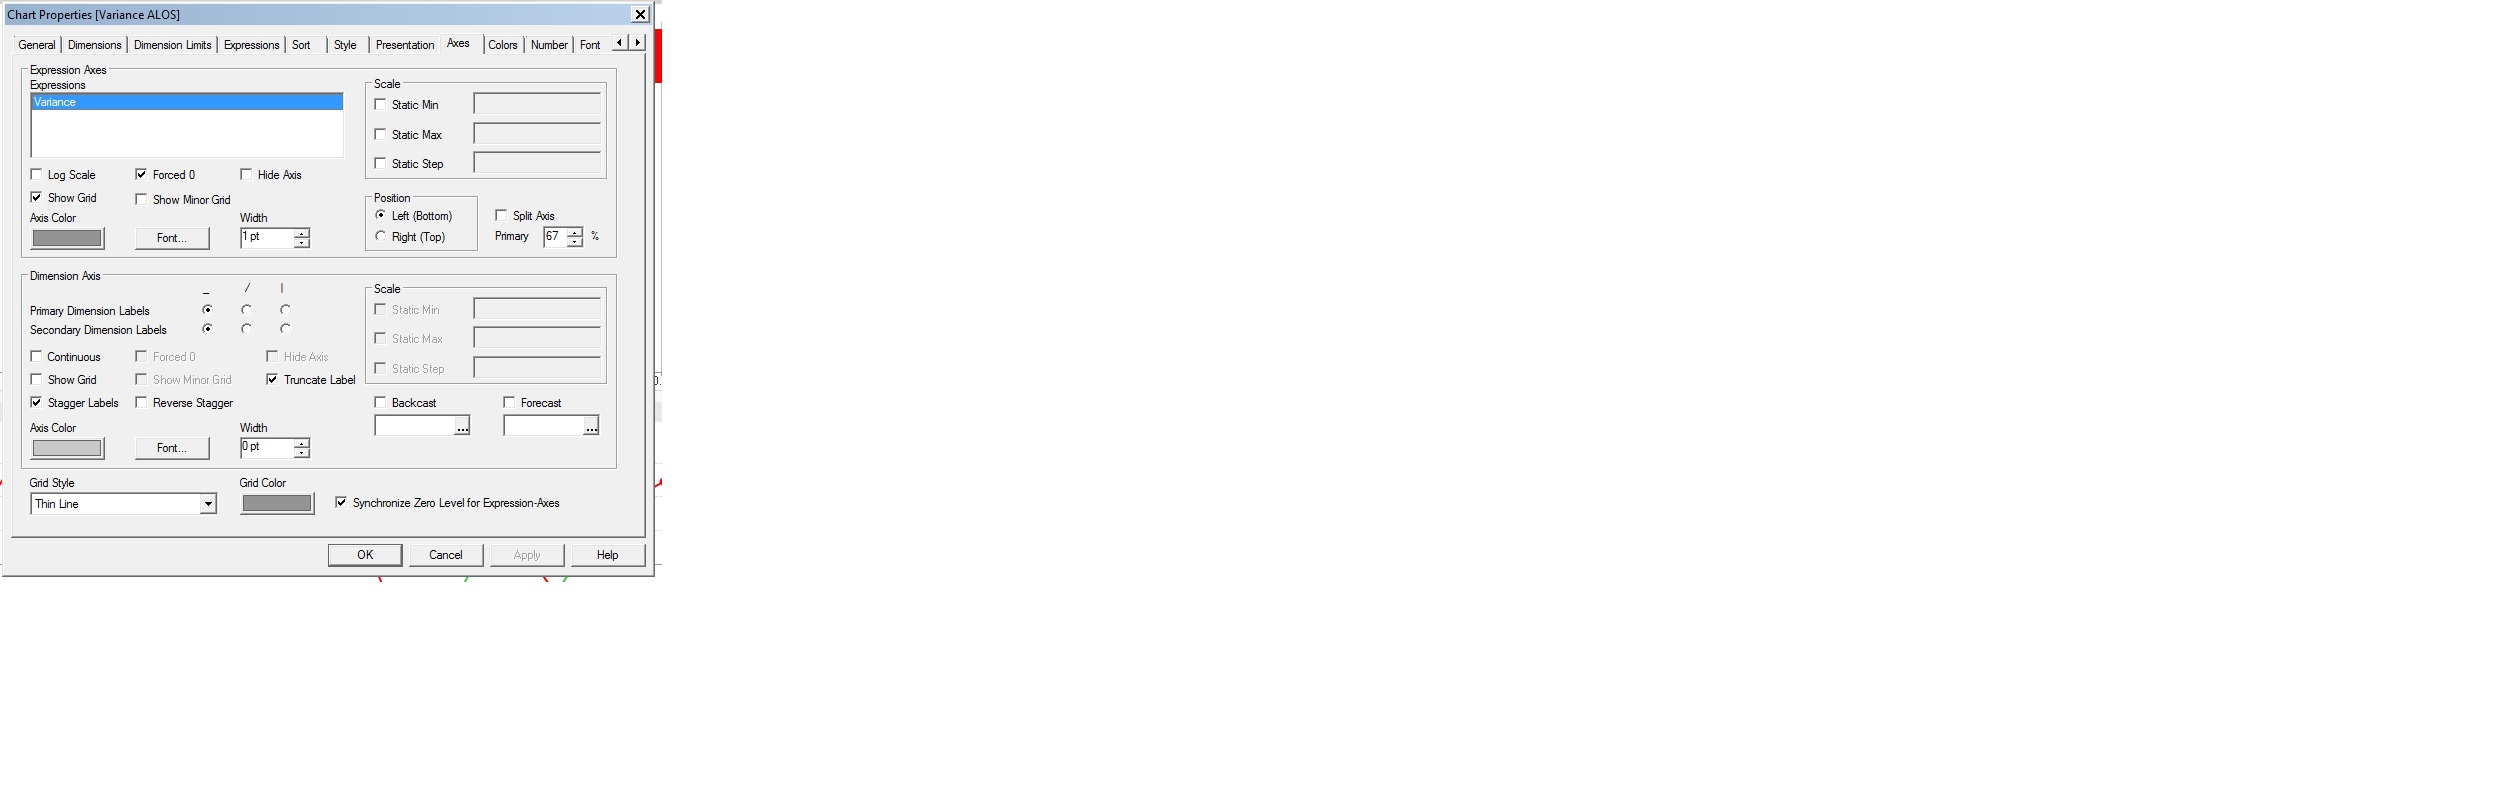
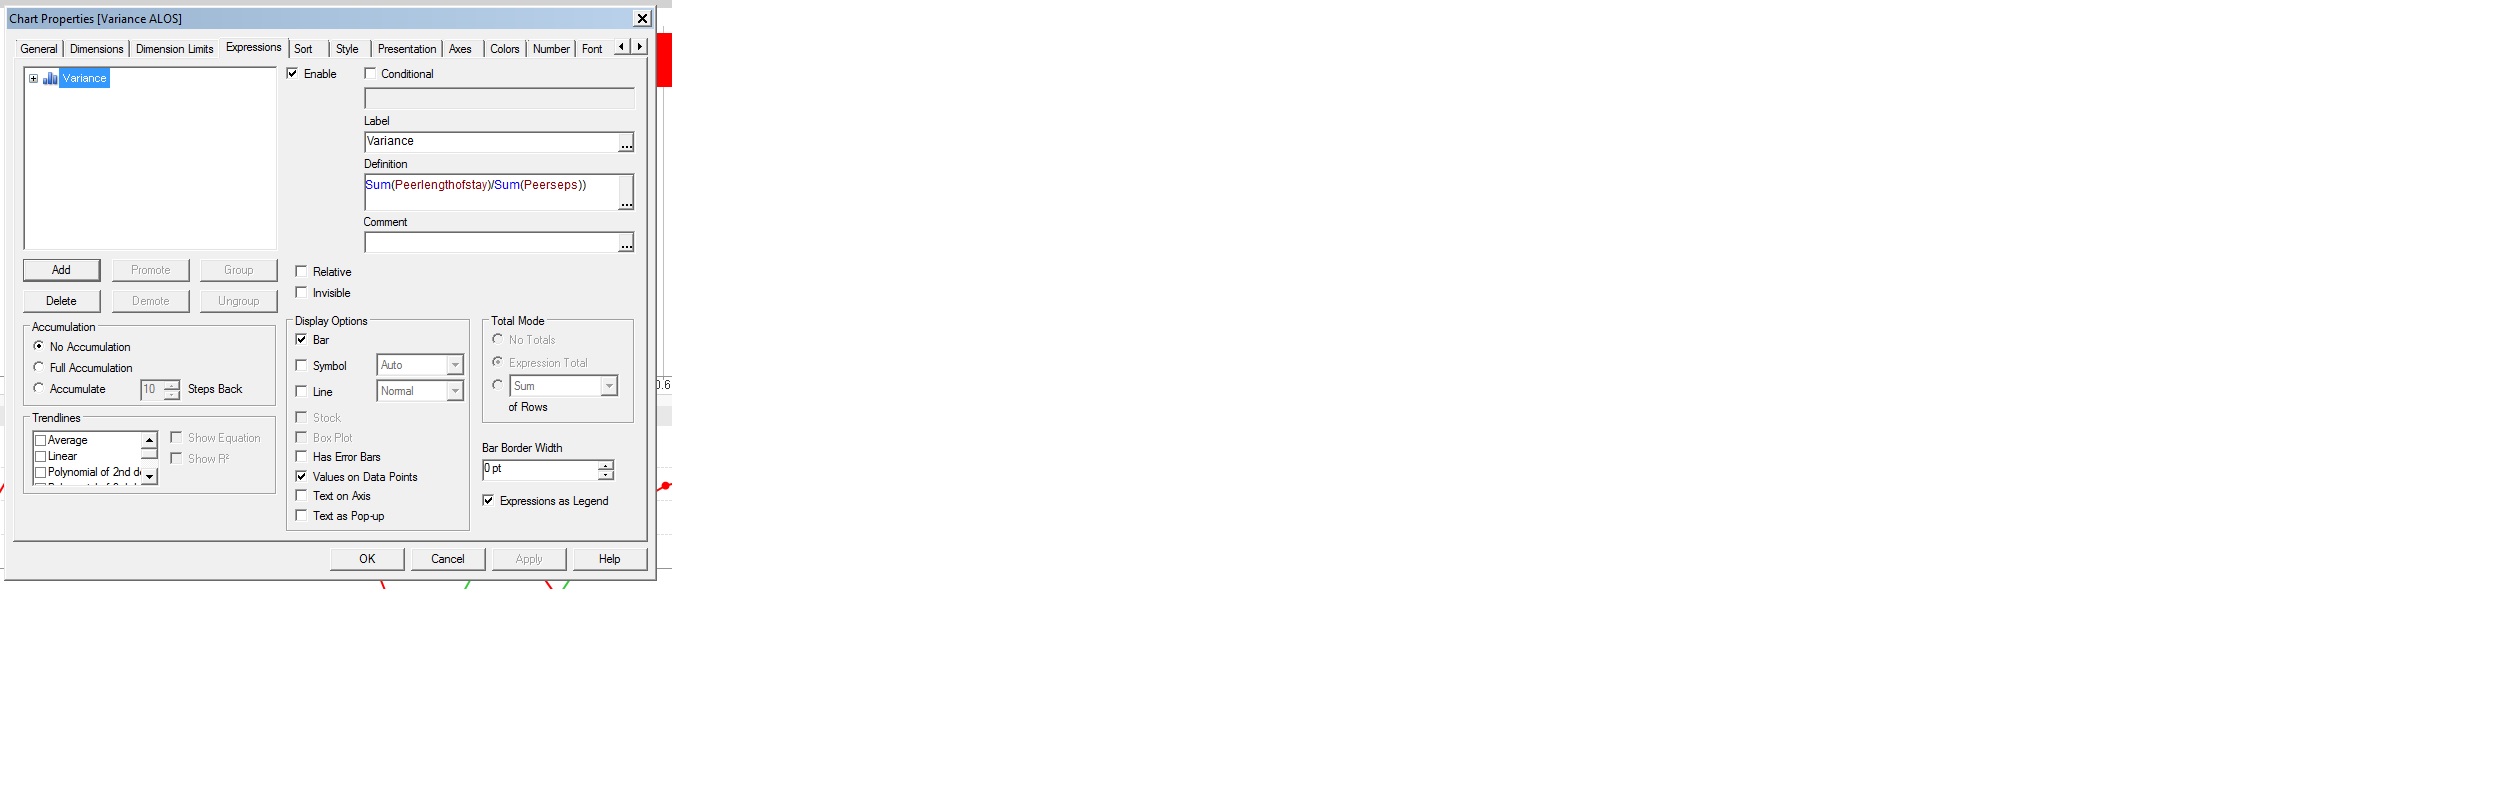
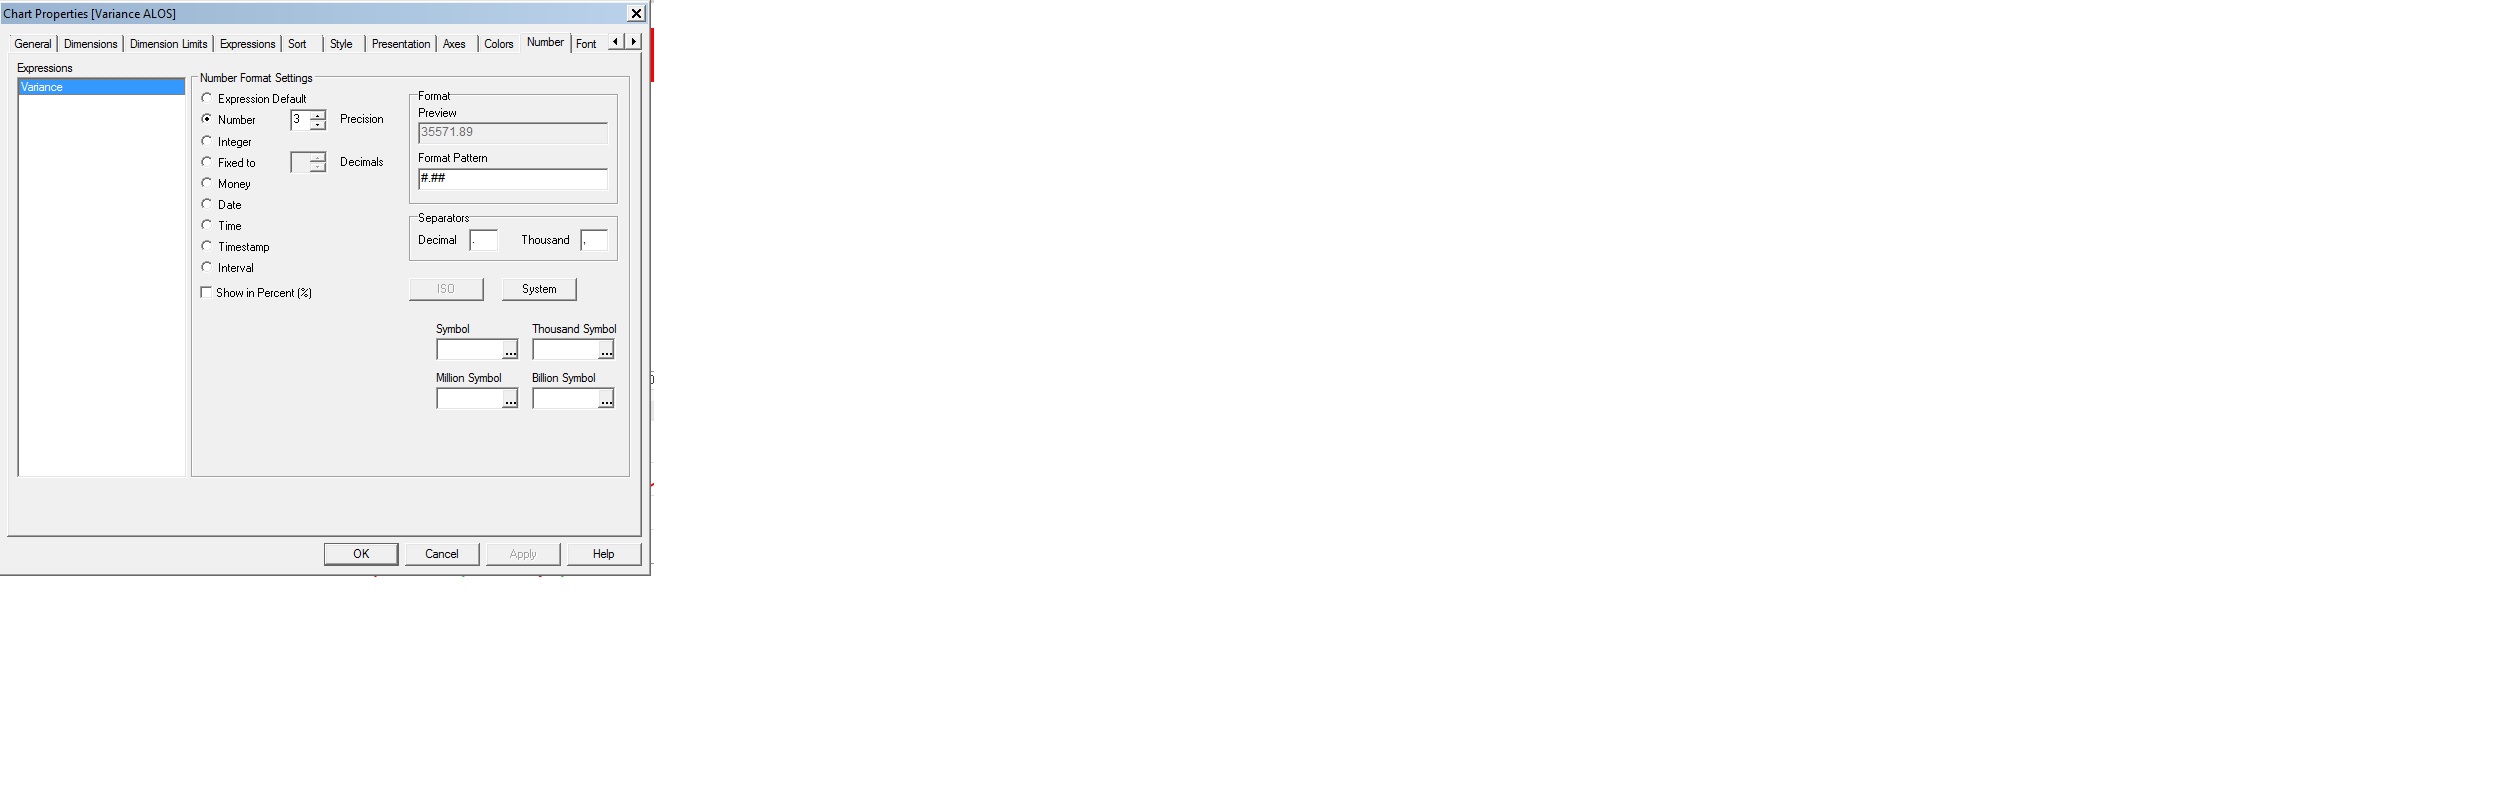
Thanks in advance.
Mahesh Gadde
- « Previous Replies
-
- 1
- 2
- Next Replies »