Unlock a world of possibilities! Login now and discover the exclusive benefits awaiting you.
- Qlik Community
- :
- All Forums
- :
- QlikView App Dev
- :
- Re: Nested Bar Chart
- Subscribe to RSS Feed
- Mark Topic as New
- Mark Topic as Read
- Float this Topic for Current User
- Bookmark
- Subscribe
- Mute
- Printer Friendly Page
- Mark as New
- Bookmark
- Subscribe
- Mute
- Subscribe to RSS Feed
- Permalink
- Report Inappropriate Content
Nested Bar Chart
I have two charts, one for displaying the main category values like the following one.
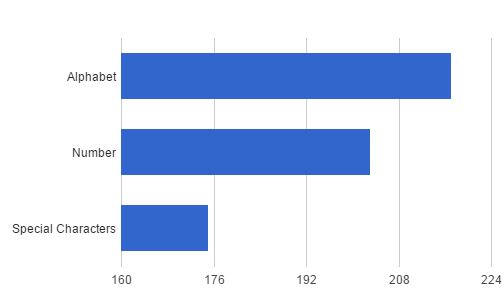
(Chart 1)
Here, Alphabet is associated with values A,B,C,D,E.... Numbers are associated with values 1,2,3...
The chart for sub-category will be like
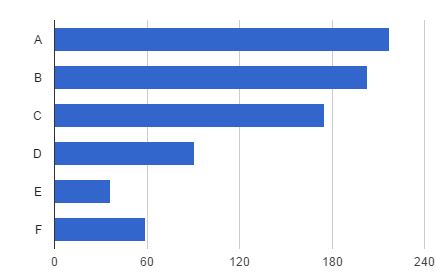
(Chart 2)
So, if the user clicks 'Alphabet' in Chart 1, Chart 2 should be shown. Instead qlikview just shows the Alphabet bar.
For changing the Dimensions we can use Cyclic groups, but the user somehow is not interested in having a Cyclic group, instead this needs to be achieved in a single click. ie When user Clicks Alphabet then the chart with A,B,C... should be shown.
Is there a way to achieve this in a single chart? Also, is there a way to return to the previous chart? ie if user wants to go back to Chart 1 from Chart 2, how can that be achieved?
Accepted Solutions
- Mark as New
- Bookmark
- Subscribe
- Mute
- Subscribe to RSS Feed
- Permalink
- Report Inappropriate Content
hi
yes you just need to create a drill down group
so as soon as the user clicks on alphabet
the dimension will change to sub-category
- Mark as New
- Bookmark
- Subscribe
- Mute
- Subscribe to RSS Feed
- Permalink
- Report Inappropriate Content
hi
yes you just need to create a drill down group
so as soon as the user clicks on alphabet
the dimension will change to sub-category