Unlock a world of possibilities! Login now and discover the exclusive benefits awaiting you.
- Qlik Community
- :
- All Forums
- :
- QlikView App Dev
- :
- No zero on line chart
- Subscribe to RSS Feed
- Mark Topic as New
- Mark Topic as Read
- Float this Topic for Current User
- Bookmark
- Subscribe
- Mute
- Printer Friendly Page
- Mark as New
- Bookmark
- Subscribe
- Mute
- Subscribe to RSS Feed
- Permalink
- Report Inappropriate Content
No zero on line chart
Hi Community,
I have a simple example like
Table name
T1:
Load * inline
[
Date, Country, Qty
1/1/2014, IND, 10
1/1/2014, THI, 10
1/2/2014, IND, 10
1/2/2014, THI, 10
1/3/2014, THI, 0.00
1/4/2014, IND, 5
1/4/2014, THI, 5
];
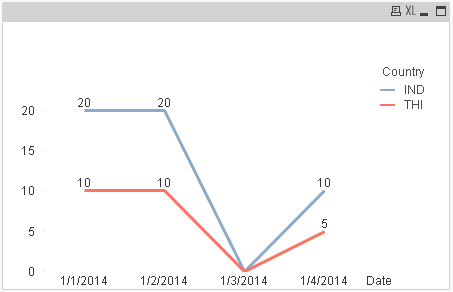
Note that here in the table, for 1/3/2014 THI is 0 and IND has no record. The Requirement is that for this data as it is, in the line chart it must show 0 for IND also for 1/3/2014 by changing an expression. Right now there will be nothing plotted for 1/3/2014 IND since the data is not there. However the pivot shows correctly for both? Is there a way to achieve this. Please find the attached QVW.
thanks,
Rajesh Vaswani
- Mark as New
- Bookmark
- Subscribe
- Mute
- Subscribe to RSS Feed
- Permalink
- Report Inappropriate Content
Change you script as below
As your data for IND and THI are same, I have changed Qty for IND
=========================
T1:
Load * inline
[
Date, Country, Qty
1/1/2014, IND, 20
1/1/2014, THI, 10
1/2/2014, IND, 20
1/2/2014, THI, 10
1/3/2014, THI, 0
1/4/2014, IND, 10
1/4/2014, THI, 5
];
MinMaxDate:
Load Min(Date) as MinDate, Max(Date) as MaxDate Resident T1;
Let vMin = NUM(PEEK('MinDate',0,'MinMaxDate'));
Let vMax = NUM(PEEK('MaxDate',0,'MinMaxDate'));
Drop Table MinMaxDate;
Calendar:
Load
Date($(vMin) + IterNo() - 1) as Date
AutoGenerate 1
While $(vMin) + IterNo() - 1 <= $(vMax);
Join
Load Distinct Country Resident T1;
Left Join (Calendar)
Load * Resident T1;
Drop Table T1;
- Mark as New
- Bookmark
- Subscribe
- Mute
- Subscribe to RSS Feed
- Permalink
- Report Inappropriate Content
Thanks for replying Manish, we want to do only expression change. The script change would be quite expensive for the current stage of release we are in.
If we can do this with just expression change please suggest.
thanks,
Rajesh Vaswani
- Mark as New
- Bookmark
- Subscribe
- Mute
- Subscribe to RSS Feed
- Permalink
- Report Inappropriate Content
As far as I know, 3rd Jan is not associated with IND, it's difficult to show 0 for the same without changing the script...
May be someone can come with better idea... I don't have any other solution... Sorry...
Would love to read comments from other members on this...
- Mark as New
- Bookmark
- Subscribe
- Mute
- Subscribe to RSS Feed
- Permalink
- Report Inappropriate Content
How many countries will you have ?
If its low and static, consider removing dimension as a country and adding multiple expressions
- Mark as New
- Bookmark
- Subscribe
- Mute
- Subscribe to RSS Feed
- Permalink
- Report Inappropriate Content
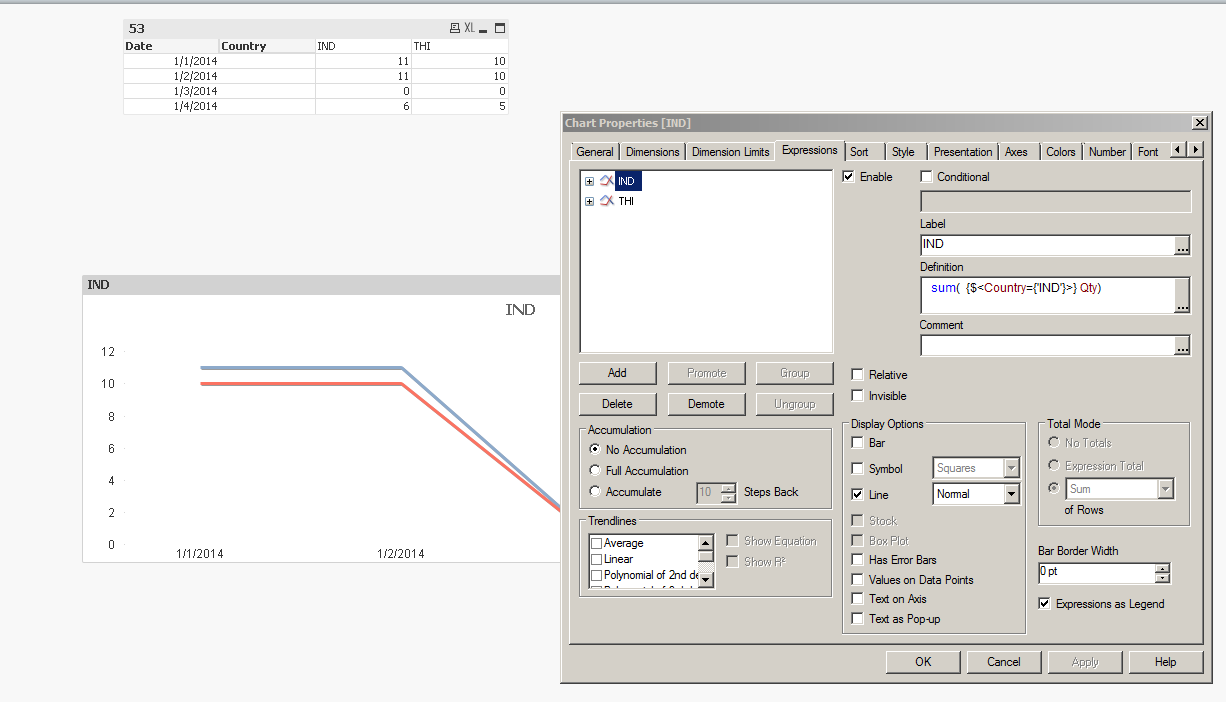
Take Country out of the dimension.
Create two Expressions.
sum( {$ < Country = {'THI'} > } Qty)
and
sum( {$ < Country = {'IND'} > } Qty)
Be aware that the lines overlap then though so you won't see both.
- Mark as New
- Bookmark
- Subscribe
- Mute
- Subscribe to RSS Feed
- Permalink
- Report Inappropriate Content
Hi,
If you take the dimension Date and Country this works well also where is problem let me know
Regards
Anand