Unlock a world of possibilities! Login now and discover the exclusive benefits awaiting you.
- Qlik Community
- :
- All Forums
- :
- QlikView App Dev
- :
- Non-associated Part of Pie Outgrayed
Options
- Subscribe to RSS Feed
- Mark Topic as New
- Mark Topic as Read
- Float this Topic for Current User
- Bookmark
- Subscribe
- Mute
- Printer Friendly Page
Turn on suggestions
Auto-suggest helps you quickly narrow down your search results by suggesting possible matches as you type.
Showing results for
Partner - Creator III
2013-11-24
10:11 AM
- Mark as New
- Bookmark
- Subscribe
- Mute
- Subscribe to RSS Feed
- Permalink
- Report Inappropriate Content
Non-associated Part of Pie Outgrayed
Hi,
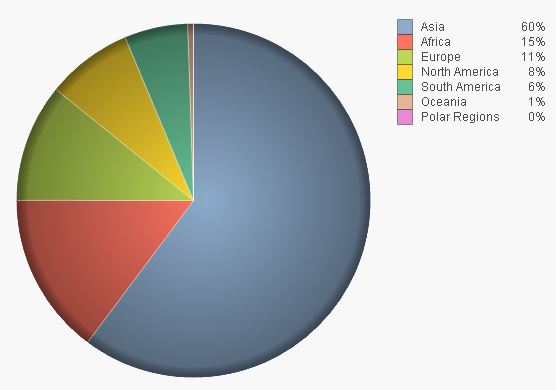
I'm looking for examples or best practices on how to get part of a Pie Chart Outgrayed after Selections.
After selecting Asia, I'd like to see 60% colored Asia and 40% gray.
Suggestions?
Has to be something like this ..

1,505 Views
1 Solution
Accepted Solutions
MVP
2013-11-24
10:43 AM
- Mark as New
- Bookmark
- Subscribe
- Mute
- Subscribe to RSS Feed
- Permalink
- Report Inappropriate Content
Maybe like attached?
3 Replies
MVP
2013-11-24
10:43 AM
- Mark as New
- Bookmark
- Subscribe
- Mute
- Subscribe to RSS Feed
- Permalink
- Report Inappropriate Content
Maybe like attached?
Partner - Creator III
2013-11-24
11:06 AM
Author
- Mark as New
- Bookmark
- Subscribe
- Mute
- Subscribe to RSS Feed
- Permalink
- Report Inappropriate Content
Hi Swuehl,
Exactly what i meant.
Thanks!
1,208 Views
Creator III
2013-11-25
11:22 AM
- Mark as New
- Bookmark
- Subscribe
- Mute
- Subscribe to RSS Feed
- Permalink
- Report Inappropriate Content
I love this.
As an add-on, I would make the expression something like
=sum({<Region *=>} Population)
so that it can react to other filters. And then sort on expression to keep the selections next to each other:
=if(match([Region],concat(distinct [Region],',')),
1,2)
mike
www.fortunecookiebi.com