Unlock a world of possibilities! Login now and discover the exclusive benefits awaiting you.
- Qlik Community
- :
- All Forums
- :
- QlikView App Dev
- :
- Normal Distribution
- Subscribe to RSS Feed
- Mark Topic as New
- Mark Topic as Read
- Float this Topic for Current User
- Bookmark
- Subscribe
- Mute
- Printer Friendly Page
- Mark as New
- Bookmark
- Subscribe
- Mute
- Subscribe to RSS Feed
- Permalink
- Report Inappropriate Content
Normal Distribution
Hey,
I have the following data set and have plotted a simple chart,
I was looking to add the curve of normal distribution to it...
Please can anyone help as i'm struggling with the function!!
please see attached,
Thanks
| Id | Duration | Type |
|---|---|---|
| 0 | 459 | x |
| 1 | 1880 | x |
| 2 | 1819 | x |
| .. | ... | ... |
- Mark as New
- Bookmark
- Subscribe
- Mute
- Subscribe to RSS Feed
- Permalink
- Report Inappropriate Content
Are you looking to normal distribution of duration, right?
- Mark as New
- Bookmark
- Subscribe
- Mute
- Subscribe to RSS Feed
- Permalink
- Report Inappropriate Content
Yes please...
- Mark as New
- Bookmark
- Subscribe
- Mute
- Subscribe to RSS Feed
- Permalink
- Report Inappropriate Content
Your data doesn´t not fall into a perfect normal distribution,
I´ve implemented a graph to help you based on a threshold
- Mark as New
- Bookmark
- Subscribe
- Mute
- Subscribe to RSS Feed
- Permalink
- Report Inappropriate Content
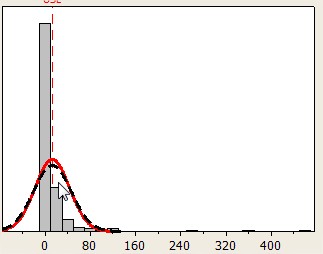
Thanks Anjos,
I was looking to replicate the below, the data i provided was a sample from this,
Red / Black lines are what im trying to achieve and was advised this represented the normal distribution
- Mark as New
- Bookmark
- Subscribe
- Mute
- Subscribe to RSS Feed
- Permalink
- Report Inappropriate Content
I can´t see right now how to generate it, I´ll do some research
- Mark as New
- Bookmark
- Subscribe
- Mute
- Subscribe to RSS Feed
- Permalink
- Report Inappropriate Content
Found this, check if fits your needs
- Mark as New
- Bookmark
- Subscribe
- Mute
- Subscribe to RSS Feed
- Permalink
- Report Inappropriate Content
PFA