Unlock a world of possibilities! Login now and discover the exclusive benefits awaiting you.
- Qlik Community
- :
- All Forums
- :
- QlikView App Dev
- :
- Re: Null handling with bar charts with 2 dimension...
- Subscribe to RSS Feed
- Mark Topic as New
- Mark Topic as Read
- Float this Topic for Current User
- Bookmark
- Subscribe
- Mute
- Printer Friendly Page
- Mark as New
- Bookmark
- Subscribe
- Mute
- Subscribe to RSS Feed
- Permalink
- Report Inappropriate Content
Null handling with bar charts with 2 dimensions
Hello,
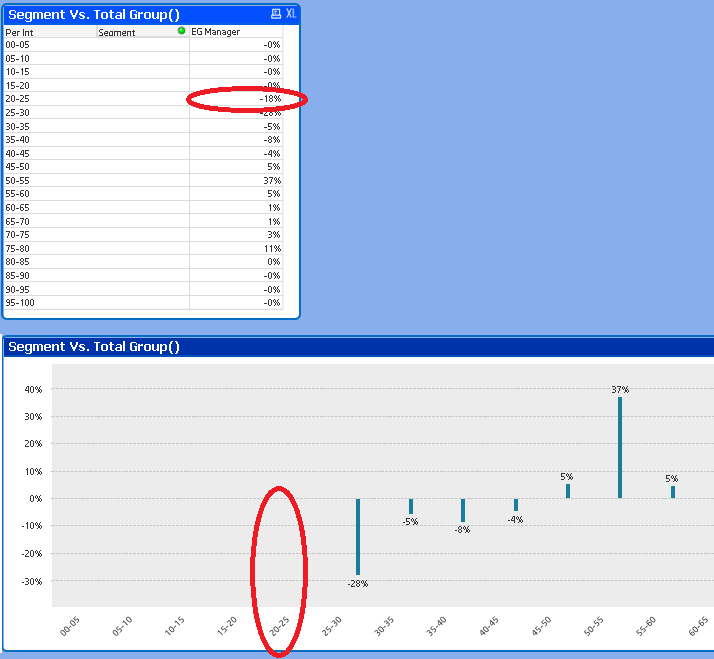
I noticed a strange thing, while working with pivots i could get the solution of replacing missing/null values with 0 so that i could perform some calculations on those cells . however when i converted the same pivot into the bar chart that problem bounced back. It seems ISNULL() only works with a table or pivot not with bar charts.
Could anybody possibly help me with this? i am attaching the sample data:

If you notice that in above pivot for 'Per Int'(20-25), I am getting -18% for EG Manager; earlier it was a missing value but this was somehow fixed using isnull()
If you notice the bottom bar graph, i have used exactly the same expression and dimension but for 20-25 Per Int range i am getting nothing.
I am also attaching the qvw file.
Thanks for your help.
Kind Regards,
Varun
- Mark as New
- Bookmark
- Subscribe
- Mute
- Subscribe to RSS Feed
- Permalink
- Report Inappropriate Content
Hi Varun,
I saw your file, if you want to eliminate the null bars please check the suppress null option in the dimensions and in the presentation please tick the suppress Zero values...this will do the work.
if u face any issue please let me know.
Regards,
@vi
- Mark as New
- Bookmark
- Subscribe
- Mute
- Subscribe to RSS Feed
- Permalink
- Report Inappropriate Content
Thanks Avinash,
Here my concern is i am not getting -18% for 20-25 range in the bar chart, but if you see the pivot table above it has -18%.
Regards,
Varun
- Mark as New
- Bookmark
- Subscribe
- Mute
- Subscribe to RSS Feed
- Permalink
- Report Inappropriate Content
Sorry Varun, i did check out your actually problem![]()
- Mark as New
- Bookmark
- Subscribe
- Mute
- Subscribe to RSS Feed
- Permalink
- Report Inappropriate Content
Hi Varun,
Could you attach your sample app again, I am not able to open it.
- Mark as New
- Bookmark
- Subscribe
- Mute
- Subscribe to RSS Feed
- Permalink
- Report Inappropriate Content
Hi Varun,
Ignore my attachment that was a mistake. actually what i understood you are using your expression with 2 dimension in Bar chart which is cause of such behavior,