Unlock a world of possibilities! Login now and discover the exclusive benefits awaiting you.
- Qlik Community
- :
- All Forums
- :
- QlikView App Dev
- :
- Null values / Band / assign a filter to a row
- Subscribe to RSS Feed
- Mark Topic as New
- Mark Topic as Read
- Float this Topic for Current User
- Bookmark
- Subscribe
- Mute
- Printer Friendly Page
- Mark as New
- Bookmark
- Subscribe
- Mute
- Subscribe to RSS Feed
- Permalink
- Report Inappropriate Content
Null values / Band / assign a filter to a row
I got the below data sample and attached is the QVW for reference. I'm trying to associate a filter column to the ID. The idea is when an user makes a filter selection, the associated data is returned. I got two issues:
1) On 'Raw Data' chart, selecting filters STAT = AB, UNIT = EDUCATION, STATE = CA, COUNTY = SAN_DIEGO, CITY= VISTA
should result in two rows - one for each zip, so the total amount should be 100 (40 + 60) not 100.
2) On 'OUTPUT' chart, I want to assign the amount based on the user filter selection to be assigned to the correct band.
Please help on what am I missing.
ID, DATE, UNIT, STAT, STATE, COUNTY, CITY, ZIP, AMOUNT
S1, 201709, EDUCATION, NULL, NULL, NULL, NULL, NULL, 1000
S2, 201709, DEFENSE, NULL, NULL, NULL, NULL, NULL, 2000
S3, 201709, EDUCATION, AB, NULL, NULL, NULL, NULL, 400
S4, 201709, EDUCATION, XY, NULL, NULL, NULL, NULL, 600
S5, 201709, DEFENSE, AB, NULL, NULL, NULL, NULL, 1200
S6, 201709, DEFENSE, XY, NULL, NULL, NULL, NULL, 800
S7, 201709, EDUCATION, AB, CA, NULL, NULL, NULL, 400
S8, 201709, EDUCATION, AB, NY, NULL, NULL, NULL, 600
S9, 201709, EDUCATION, AB, CA, SAN_DIEGO, NULL, NULL, 300
S10,201709, EDUCATION, AB, CA, SFO, SFO, NULL, 100
S11,201709, EDUCATION, AB, NY, SUFFOLK, NULL, NULL, 600
S12,201709, EDUCATION, AB, CA, SAN_DIEGO, SAN_DIEGO, NULL, 200
S13,201709, EDUCATION, AB, CA, SAN_DIEGO, VISTA, NULL, 100
S14,201709, EDUCATION, AB, CA, SFO, SFO, NULL, 100
S15,201709, EDUCATION, AB, CA, SAN_DIEGO, SAN_DIEGO, 90123, 120
S16,201709, EDUCATION, AB, CA, SAN_DIEGO, SAN_DIEGO, 90125, 80
S17,201709, EDUCATION, AB, CA, SAN_DIEGO, VISTA, 91234, 40
S18,201709, EDUCATION, AB, CA, SAN_DIEGO, VISTA, 91235, 60
S19,201709, EDUCATION, AB, CA, SFO, SFO, 90001, 100
- « Previous Replies
-
- 1
- 2
- Next Replies »
Accepted Solutions
- Mark as New
- Bookmark
- Subscribe
- Mute
- Subscribe to RSS Feed
- Permalink
- Report Inappropriate Content
For 1st issue... may be use this
Sum({<ZIP -= {'NULL'}>}AMOUNT)
For 2nd, what is the correct band here?
- Mark as New
- Bookmark
- Subscribe
- Mute
- Subscribe to RSS Feed
- Permalink
- Report Inappropriate Content
For 1st issue... may be use this
Sum({<ZIP -= {'NULL'}>}AMOUNT)
For 2nd, what is the correct band here?
- Mark as New
- Bookmark
- Subscribe
- Mute
- Subscribe to RSS Feed
- Permalink
- Report Inappropriate Content
For band,
Any total amount >= 0 and <= 50 should be in 0-50 band
Any total amount >50 and <= 100 should be in 50-100 band
Any total amount >100 and <= 200 should be in 100-200 band
Any total amount >200 and <= 400 should be in 200-400 band
Any total amount >400 and <= 10000 should be in 400-10000 band
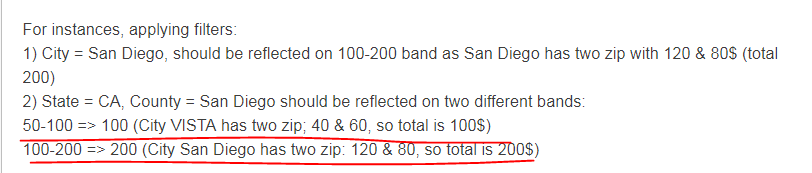
For instances, applying filters:
1) City = San Diego, should be reflected on 100-200 band as San Diego has two zip with 120 & 80$ (total 200)
2) State = CA, County = San Diego should be reflected on two different bands:
50-100 => 100 (City VISTA has two zip; 40 & 60, so total is 100$)
100-200 => 200 (City San Diego has two zip: 120 & 80, so total is 200$)
- Mark as New
- Bookmark
- Subscribe
- Mute
- Subscribe to RSS Feed
- Permalink
- Report Inappropriate Content
Try this
Calculated dimension
Low
=Aggr(If(SUM({<ZIP -= {'NULL'}>} AMOUNT) > 50 and SUM({<ZIP -= {'NULL'}>} AMOUNT) <= 100, 50,
If(SUM({<ZIP -= {'NULL'}>} AMOUNT) > 100 and SUM({<ZIP -= {'NULL'}>} AMOUNT) <= 200, 100,
If(SUM({<ZIP -= {'NULL'}>} AMOUNT) > 200 and SUM({<ZIP -= {'NULL'}>} AMOUNT) <= 400, 200))), CITY)
High
=Aggr(If(SUM({<ZIP -= {'NULL'}>} AMOUNT) > 50 and SUM({<ZIP -= {'NULL'}>} AMOUNT) <= 100, 100,
If(SUM({<ZIP -= {'NULL'}>} AMOUNT) > 100 and SUM({<ZIP -= {'NULL'}>} AMOUNT) <= 200, 200,
If(SUM({<ZIP -= {'NULL'}>} AMOUNT) > 200 and SUM({<ZIP -= {'NULL'}>} AMOUNT) <= 400, 400))), CITY)
Expression
Sum({<ZIP -= {'NULL'}>}AMOUNT)
- Mark as New
- Bookmark
- Subscribe
- Mute
- Subscribe to RSS Feed
- Permalink
- Report Inappropriate Content
Hi Sunny, I think it's working for the above cases but I noticed few cases where it isn't.
1) Can we display all the bands even though there's no value or 0 value for Amount? I tried adding sum({1} 0) to the expression but that didn't seem to work.
Selecting filters:
2) Unit = Education, Stat = XY, think it should display 600. It displays 0
3) Unit = Defense, Stat = XY, think it should display 800. It displays 0
4) Unit = Defense, Stat = AB, think it should display 1200. It displays 0
5) Stat = Education only, think it should display 1000
6) Stat = Defense only, think it should display 2000
- Mark as New
- Bookmark
- Subscribe
- Mute
- Subscribe to RSS Feed
- Permalink
- Report Inappropriate Content
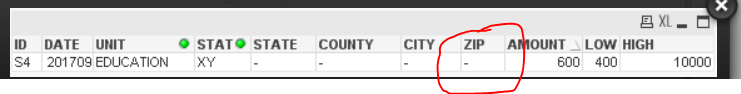
Strictly looking at number 2 point above.... Zip is NULL
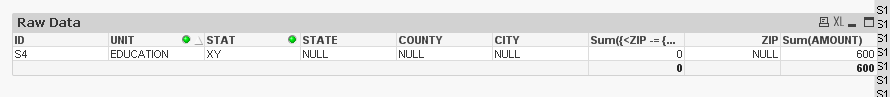
Why is the sum 600? Am I missing something, I thought you wanted to exclude NULL ZIPs?
- Mark as New
- Bookmark
- Subscribe
- Mute
- Subscribe to RSS Feed
- Permalink
- Report Inappropriate Content
Sorry for any confusion. The goal here is: when an user makes a selection from the multi-box filter, it should reflect the corresponding value in the chart.
In this example (no 2), although all other column values are NULL, the total amount for Unit = Education and Stat = XY is 600$. Hence, the output band table should display 600$ on 400-10000 band.

- Mark as New
- Bookmark
- Subscribe
- Mute
- Subscribe to RSS Feed
- Permalink
- Report Inappropriate Content
But then it means that the results for other selections should be different also, right?
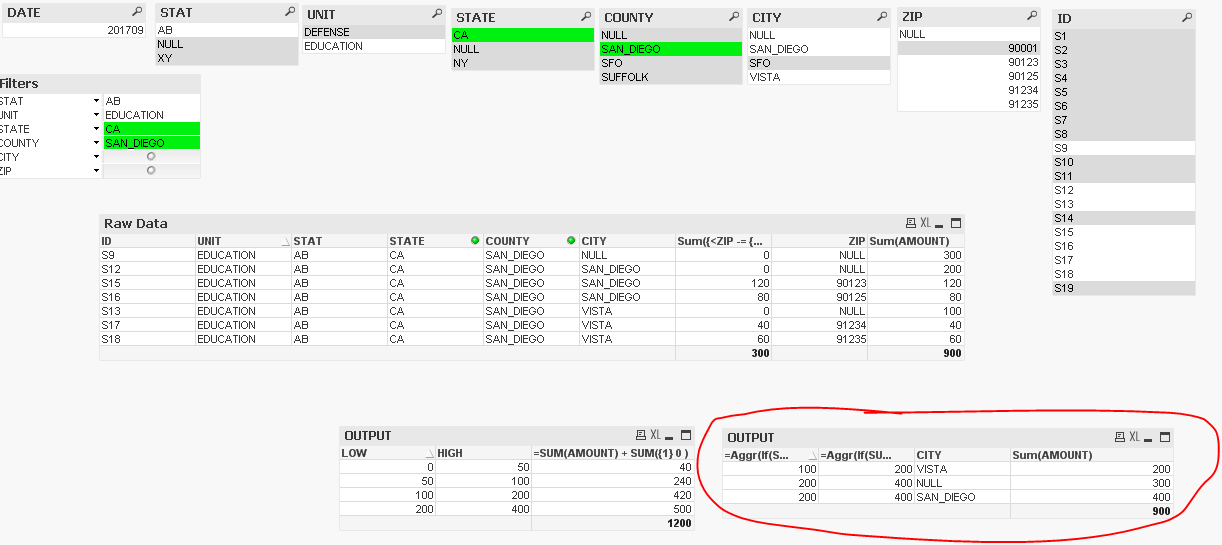
Here I selected STATE = CA and COUNTY = SAN_DIEGO... this will no more show this
- Mark as New
- Bookmark
- Subscribe
- Mute
- Subscribe to RSS Feed
- Permalink
- Report Inappropriate Content
In the above output table example you highlighted, yes that's not correct.
I guess if we can somehow exclude all the rows with NULL we might get the correct total. Also, looks like the Amount for San Diego City and Vista is doubled. Again, it appears because of NULL values for City and Zip.
The total amount for San Diego City is 200 and Vista is 100.
Is this not possible to accomplish in conjunction with the cases (2-6) I listed above?

- Mark as New
- Bookmark
- Subscribe
- Mute
- Subscribe to RSS Feed
- Permalink
- Report Inappropriate Content
I guess if we can somehow exclude all the rows with NULL we might get the correct total.
But when we did that here... you were not happy with the output
In this case your wanted the Amount to show 600.
I am confused as to what you want my friend 
- « Previous Replies
-
- 1
- 2
- Next Replies »