Unlock a world of possibilities! Login now and discover the exclusive benefits awaiting you.
- Qlik Community
- :
- All Forums
- :
- QlikView App Dev
- :
- Null values in chart
- Subscribe to RSS Feed
- Mark Topic as New
- Mark Topic as Read
- Float this Topic for Current User
- Bookmark
- Subscribe
- Mute
- Printer Friendly Page
- Mark as New
- Bookmark
- Subscribe
- Mute
- Subscribe to RSS Feed
- Permalink
- Report Inappropriate Content
Null values in chart
I have a table that uses the expression
=sum({$<FiscalMonthNumeric = {"<=$(=max(FiscalMonthNumeric))"}, Month=>}Data)
and the results of this are
Apr 5%
May 6.78%
Jun 0%
Jul 4.76%
Aug 1.75%
The bar chart only shows the results that aren't 0 (i.e. Apr, May, Jul and Aug)
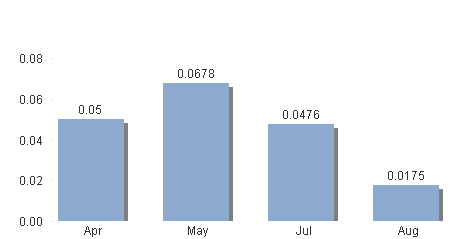
I have "Show All Values" selected but it makes no difference. How do I get it to show June's zero figure?
Thanks
Accepted Solutions
- Mark as New
- Bookmark
- Subscribe
- Mute
- Subscribe to RSS Feed
- Permalink
- Report Inappropriate Content
The below gives me the correct results I need to show only valid months based on my selection, but also includes null values (Also I have the "Show All Values" unticked on the dimensions tab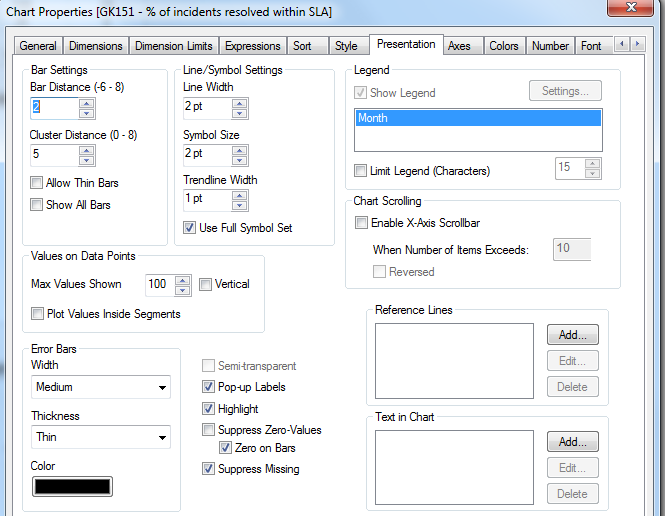
- Mark as New
- Bookmark
- Subscribe
- Mute
- Subscribe to RSS Feed
- Permalink
- Report Inappropriate Content
Hi,
Uncheck supress Null Values and Supress Missing from Presentation tab
and Check Show all VAlues in dimension tab
Regards
Please appreciate our Qlik community members by giving Kudos for sharing their time for your query. If your query is answered, please mark the topic as resolved 🙂
- Mark as New
- Bookmark
- Subscribe
- Mute
- Subscribe to RSS Feed
- Permalink
- Report Inappropriate Content
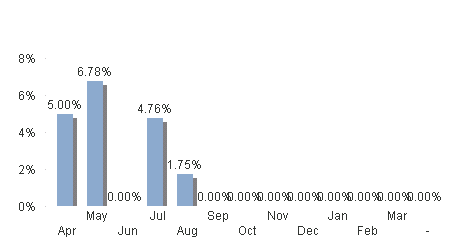
Cheers Max, that adds Jun but it also add future months which I dont wish to show yet. Is there something in the set analysis I can do to remove those?
Thanks
- Mark as New
- Bookmark
- Subscribe
- Mute
- Subscribe to RSS Feed
- Permalink
- Report Inappropriate Content
The below gives me the correct results I need to show only valid months based on my selection, but also includes null values (Also I have the "Show All Values" unticked on the dimensions tab