Unlock a world of possibilities! Login now and discover the exclusive benefits awaiting you.
- Qlik Community
- :
- All Forums
- :
- QlikView App Dev
- :
- Nulls formatting
- Subscribe to RSS Feed
- Mark Topic as New
- Mark Topic as Read
- Float this Topic for Current User
- Bookmark
- Subscribe
- Mute
- Printer Friendly Page
- Mark as New
- Bookmark
- Subscribe
- Mute
- Subscribe to RSS Feed
- Permalink
- Report Inappropriate Content
Nulls formatting
Hi All,
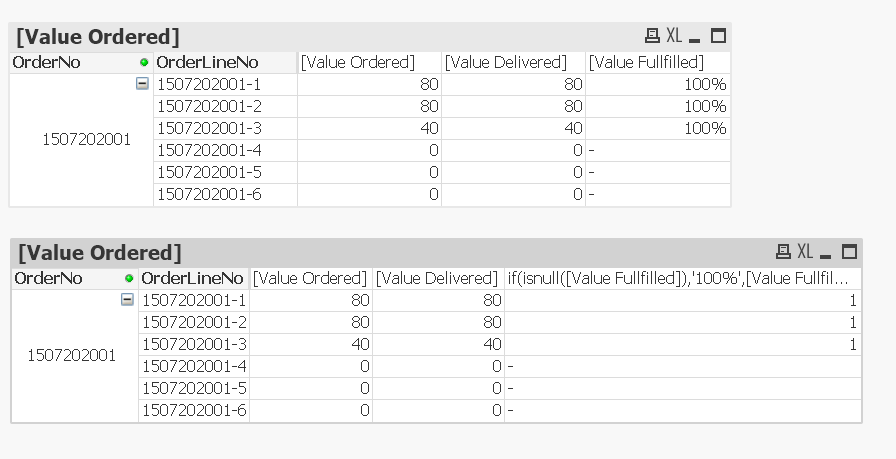
I have the below data and i would like to show 100% wherever the value fullfilled is Null(-).
I tried the expression like if(isnull([Value Fullfilled]),'100%',[Value Fullfilled]) but not getting the expected result.
Thanks.
- « Previous Replies
-
- 1
- 2
- Next Replies »
- Mark as New
- Bookmark
- Subscribe
- Mute
- Subscribe to RSS Feed
- Permalink
- Report Inappropriate Content
Hi,
you can try this, you will found it at the bottom of the presentation tab of this type of chart you're using:
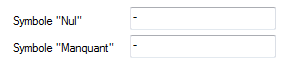
you can replace null values and missing values.
- Mark as New
- Bookmark
- Subscribe
- Mute
- Subscribe to RSS Feed
- Permalink
- Report Inappropriate Content
Hi, I tried the above steps but it doesn't have any effect. These setting will apply to the whole chart.
But i need to format only the value fulfilled column.
Thank you.
- Mark as New
- Bookmark
- Subscribe
- Mute
- Subscribe to RSS Feed
- Permalink
- Report Inappropriate Content
What about this:
If(len(trim([Value Fullfilled]))= 0 or [Value Fullfilled]='NULL' or [Value Fullfilled] ='-', '100%', [Value Fullfilled])
Farol BI
WhatsApp: 24 98152-1675
Skype: justen.thiago
- Mark as New
- Bookmark
- Subscribe
- Mute
- Subscribe to RSS Feed
- Permalink
- Report Inappropriate Content
I would suggest this:
If(len(trim([Value Fullfilled]))= 0 or [Value Fullfilled]='' or isnull([Value Fullfilled]), '100%', [Value Fullfilled])
- Mark as New
- Bookmark
- Subscribe
- Mute
- Subscribe to RSS Feed
- Permalink
- Report Inappropriate Content
Handling with null values is more complicated than we sometimes imagine.
Farol BI
WhatsApp: 24 98152-1675
Skype: justen.thiago
- Mark as New
- Bookmark
- Subscribe
- Mute
- Subscribe to RSS Feed
- Permalink
- Report Inappropriate Content
Hi thank you. Its working as expected.
- Mark as New
- Bookmark
- Subscribe
- Mute
- Subscribe to RSS Feed
- Permalink
- Report Inappropriate Content
Yeah it worked. thanks
- Mark as New
- Bookmark
- Subscribe
- Mute
- Subscribe to RSS Feed
- Permalink
- Report Inappropriate Content
You're welcome !
don't forget to close the thread by marking correct and helpful answers
- Mark as New
- Bookmark
- Subscribe
- Mute
- Subscribe to RSS Feed
- Permalink
- Report Inappropriate Content
yes i did.
- « Previous Replies
-
- 1
- 2
- Next Replies »