Unlock a world of possibilities! Login now and discover the exclusive benefits awaiting you.
- Qlik Community
- :
- All Forums
- :
- QlikView App Dev
- :
- Re: Number Formatting in Data Points of Line Chart
- Subscribe to RSS Feed
- Mark Topic as New
- Mark Topic as Read
- Float this Topic for Current User
- Bookmark
- Subscribe
- Mute
- Printer Friendly Page
- Mark as New
- Bookmark
- Subscribe
- Mute
- Subscribe to RSS Feed
- Permalink
- Report Inappropriate Content
Number Formatting in Data Points of Line Chart
Hi,
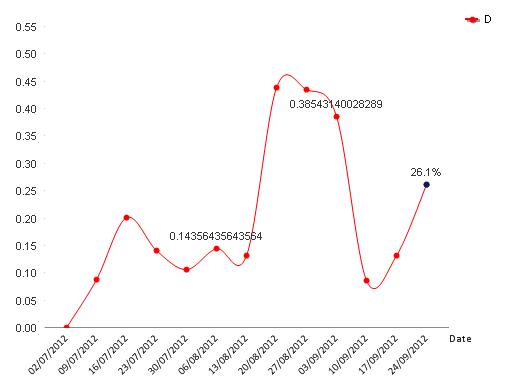
I am getting values in decimals on data point view. I have attached the application sample. Please suggest, how to conver the values to percentage(%).

Regards,
Santhosh
- Mark as New
- Bookmark
- Subscribe
- Mute
- Subscribe to RSS Feed
- Permalink
- Report Inappropriate Content
hi
I think attached file helps you..
Please close the thread by marking correct answer & give likes if you like the post.
- Mark as New
- Bookmark
- Subscribe
- Mute
- Subscribe to RSS Feed
- Permalink
- Report Inappropriate Content
hi there are two ways of doing this.
1) in the properties of the chart u have a number tab there u can set it as percentage.
2) if u want to show only the specified values like max or min. in the expression tab when u extent the + sign , u will find the show values , there u can write ur expression to convert to the value by multiplying with *100 and appending the % sign.
sorry i was not able to open the application. may be this can help you...
- Mark as New
- Bookmark
- Subscribe
- Mute
- Subscribe to RSS Feed
- Permalink
- Report Inappropriate Content
Thanks for your reply Ramaswamy. This is not working on the other expressions. Also I want to display the numbers only on 1st date of each month and the latest date not on all the data points.
- Mark as New
- Bookmark
- Subscribe
- Mute
- Subscribe to RSS Feed
- Permalink
- Report Inappropriate Content
Thanks for your reply Shree. I tried both the options. Not working. Attaching the file once again.