Unlock a world of possibilities! Login now and discover the exclusive benefits awaiting you.
- Qlik Community
- :
- All Forums
- :
- QlikView App Dev
- :
- Re: Number of rows in a table
- Subscribe to RSS Feed
- Mark Topic as New
- Mark Topic as Read
- Float this Topic for Current User
- Bookmark
- Subscribe
- Mute
- Printer Friendly Page
- Mark as New
- Bookmark
- Subscribe
- Mute
- Subscribe to RSS Feed
- Permalink
- Report Inappropriate Content
Number of rows in a table
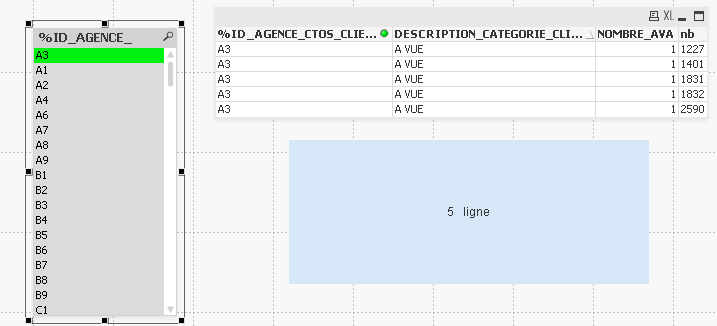
I want to display the row number of the array, the column "nb" is the primary key,
So I did a COUNT (nb), in the case I add the nb column to the array, the result is correct if I delete the column the tablau is incorrect
first with nb column :
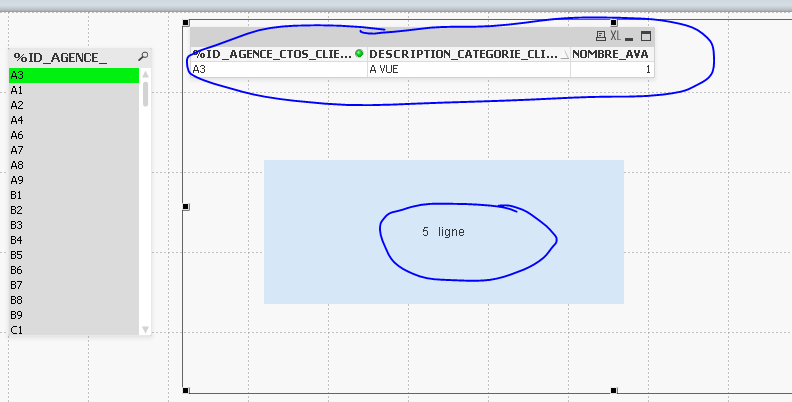
second without
the script :
LOAD
RowNo() as nb,
MOIS,
ANNEE,
STAUT_CLIENT,
MARCHE,
DESCRIPTION_MARCHE_CLIENT,
AGE_RELATION,
DESCRIPTION_CATEGORIE_CLIENT,
%ID_CATEGORIE_CLIENT,
SEGMENT,
CONQUETE,
ANCIENNETE_RELATION,
STATUT_AVA,
PROD_AVA,
%ID_AGENCE_CTOS_CLIENT,
SOUS_MARCHE,
SEGMENT_2015,
TYPE_SOUS_MARCHE,
NOMBRE_AVA
FROM
C:\pfe\DONNEES_RECAP\AVA.qvd
(qvd);
- Tags:
- qlikview_scripting
- « Previous Replies
- Next Replies »
Accepted Solutions
- Mark as New
- Bookmark
- Subscribe
- Mute
- Subscribe to RSS Feed
- Permalink
- Report Inappropriate Content
May be use a straight table instead of table box and then you can add your 3 columns and nb as dimensions and on the presentation tab, do two things
1) uncheck 'Suppress Zero Values' and
2) Hide nb column from displaying
- Mark as New
- Bookmark
- Subscribe
- Mute
- Subscribe to RSS Feed
- Permalink
- Report Inappropriate Content
Hi,
Can you explain little bit more in details??
Regards,
Please appreciate our Qlik community members by giving Kudos for sharing their time for your query. If your query is answered, please mark the topic as resolved 🙂
- Mark as New
- Bookmark
- Subscribe
- Mute
- Subscribe to RSS Feed
- Permalink
- Report Inappropriate Content
for agence= a3 i have 3 records , but the table display one row, and if i add the nb colomun , the table display the 3 rows
- Mark as New
- Bookmark
- Subscribe
- Mute
- Subscribe to RSS Feed
- Permalink
- Report Inappropriate Content
try
=count(aggr(count(1), %ID_CATEGORIE_CLIENT, DESCRIPTION_CATEGORIE_CLIENT,N OMBRE_AVA))
- Mark as New
- Bookmark
- Subscribe
- Mute
- Subscribe to RSS Feed
- Permalink
- Report Inappropriate Content


THE PROBLEM IN THE TABLE AND NOT THE COUNT
- Mark as New
- Bookmark
- Subscribe
- Mute
- Subscribe to RSS Feed
- Permalink
- Report Inappropriate Content
Hi,
this is because qlikview show number of distinct records w.r.t columns.
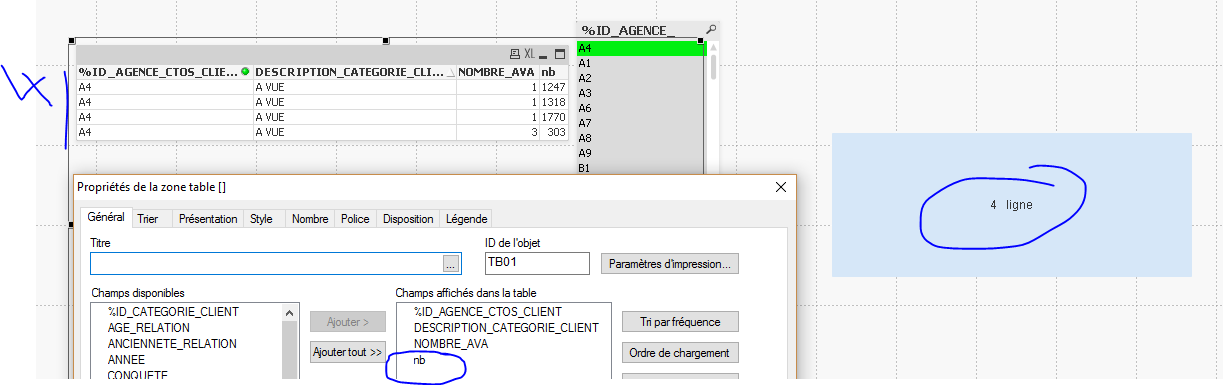
When you add nb column in table box then it will show 4 records because it have 4 distinct rows
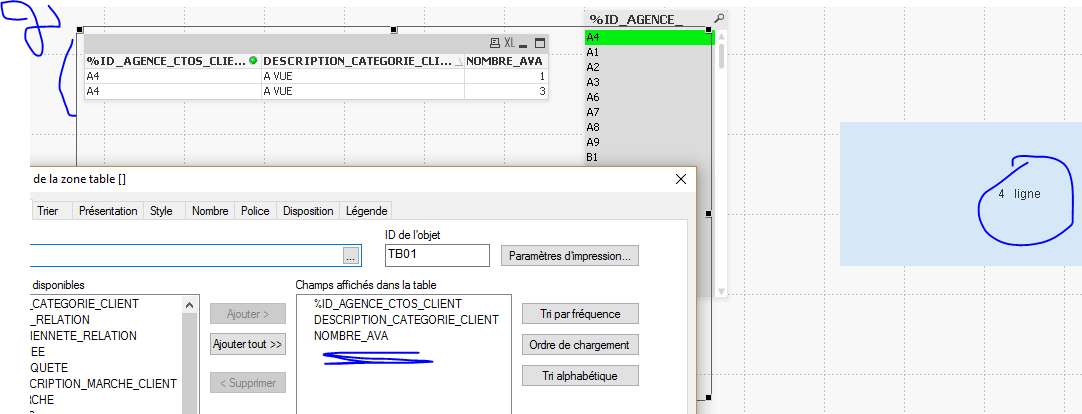
similarly if you remove Nomber_Ava field from table box then it will give only 1 rows in table box
Regards,
Please appreciate our Qlik community members by giving Kudos for sharing their time for your query. If your query is answered, please mark the topic as resolved 🙂
- Mark as New
- Bookmark
- Subscribe
- Mute
- Subscribe to RSS Feed
- Permalink
- Report Inappropriate Content
=count(aggr(count(1), %ID_CATEGORIE_CLIENT, DESCRIPTION_CATEGORIE_CLIENT))
for the second table...
Continue to change the aggr each time the dimension changes...
- Mark as New
- Bookmark
- Subscribe
- Mute
- Subscribe to RSS Feed
- Permalink
- Report Inappropriate Content
A table box is a set of grouped listboxes that displays all possible combinations of listbox values. You can simulate a count of the number of values in those listboxes by using an expression like:
=count(DISTINCT %ID_CATEGORIE_CLIENT, & DESCRIPTION_CATEGORIE_CLIENT & NOMBRE_AVA)
This expression should follow all other selections, as the table box cannot be made to filter out anything (no set analysis, no expressions, no nothing) except by making selections.
- Mark as New
- Bookmark
- Subscribe
- Mute
- Subscribe to RSS Feed
- Permalink
- Report Inappropriate Content
Table box always shows the unique combination of the fields added to the table.... If you exclude nb (which is your unqiue identifier) you are only seeing the unique rows. Why do you not want to add nb in there?
- Mark as New
- Bookmark
- Subscribe
- Mute
- Subscribe to RSS Feed
- Permalink
- Report Inappropriate Content
I think you still misunderstand the way a Table Box operates. A Table Box is not a table, it's just a combination of listboxes, and listboxes show every distinct value only once !
The same happens with combinations of listboxes. Every uniqe combination is shown only once, whatever the gigantic table is that contains the base rows.
- « Previous Replies
- Next Replies »