Unlock a world of possibilities! Login now and discover the exclusive benefits awaiting you.
- Qlik Community
- :
- All Forums
- :
- QlikView App Dev
- :
- Re: Number still showing decimals
- Subscribe to RSS Feed
- Mark Topic as New
- Mark Topic as Read
- Float this Topic for Current User
- Bookmark
- Subscribe
- Mute
- Printer Friendly Page
- Mark as New
- Bookmark
- Subscribe
- Mute
- Subscribe to RSS Feed
- Permalink
- Report Inappropriate Content
Number still showing decimals
Hi everyone,
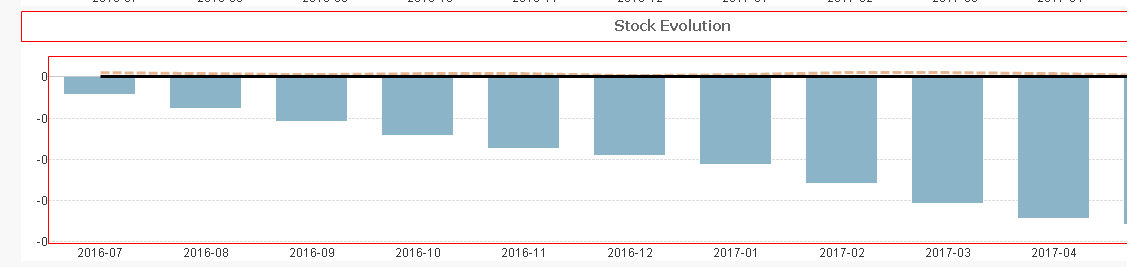
I have created a bat chart, where I put is some quantities. In the chart properties, I have selected to display these quantities as 'Integer' in the 'Numbers' tab when the .
Nevertheless, the bar graph still shows decimals when all quantities equal zero (see attached print screens). I have tried to get rid of the decimals by using the Round() function, but it did not help.
Any suggestions ?
Accepted Solutions
- Mark as New
- Bookmark
- Subscribe
- Mute
- Subscribe to RSS Feed
- Permalink
- Report Inappropriate Content
Hi,
Thanks to all of you for your suggestions.
I have solved the problem by rounding the quantities in my load script. Now, the bar chart shows a flat line on the X-axis when all quantities are close to zero, which is what I needed.
- Mark as New
- Bookmark
- Subscribe
- Mute
- Subscribe to RSS Feed
- Permalink
- Report Inappropriate Content
Could you show an example of your QVW?
- Mark as New
- Bookmark
- Subscribe
- Mute
- Subscribe to RSS Feed
- Permalink
- Report Inappropriate Content
Hi James,
Attached, my QVW file.
- Mark as New
- Bookmark
- Subscribe
- Mute
- Subscribe to RSS Feed
- Permalink
- Report Inappropriate Content
Hi,
In expression give the number format required some thing similar to below.
Sum(Amount)
Change to:
Num(Sum(Amount),'##')
In chart properties number tab->Expression default
- Mark as New
- Bookmark
- Subscribe
- Mute
- Subscribe to RSS Feed
- Permalink
- Report Inappropriate Content
Hi,
Can you check if the below resolves.

Thanks
- Mark as New
- Bookmark
- Subscribe
- Mute
- Subscribe to RSS Feed
- Permalink
- Report Inappropriate Content
Hi, thanks for the file.
I don't understand what you're trying to achieve, though.
Your bars all have values to the 4th decimal place and showing them as integers just cuts off the shown value to -0, the bars will remain the same size etc. The table shows the values to 6 decimal places when you remove the 'show as integer' value.
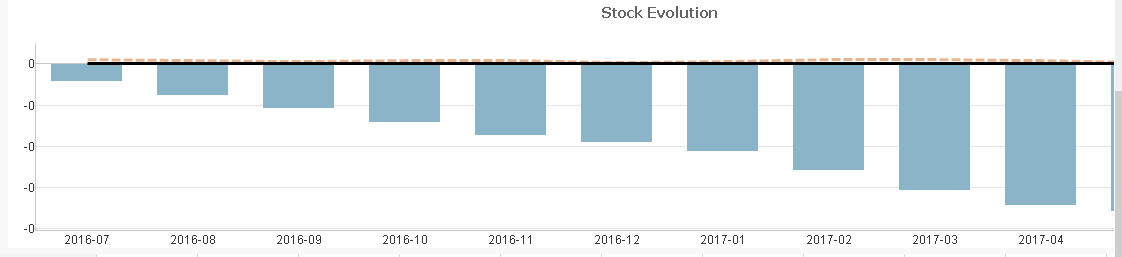
If you set the table values back to default, you get:
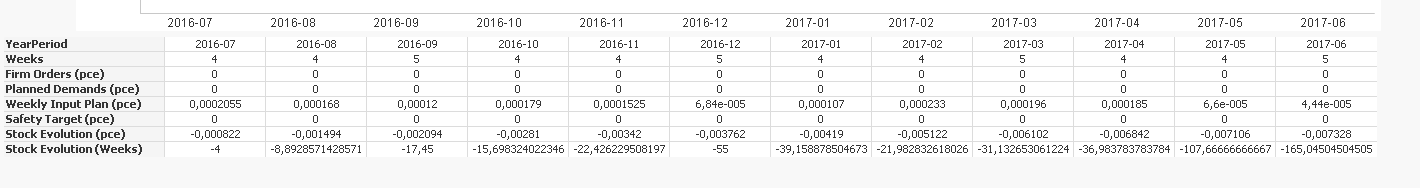
You do not have zero values and so the calculations are not zero.
- Mark as New
- Bookmark
- Subscribe
- Mute
- Subscribe to RSS Feed
- Permalink
- Report Inappropriate Content
Hi, Duchateau Filip.
Use the keyboard about bar chart Ctrl+Shift+button left of mouse and drag on the comma. See figure below.
Hope this helps!
- Mark as New
- Bookmark
- Subscribe
- Mute
- Subscribe to RSS Feed
- Permalink
- Report Inappropriate Content
Hi,
Thanks to all of you for your suggestions.
I have solved the problem by rounding the quantities in my load script. Now, the bar chart shows a flat line on the X-axis when all quantities are close to zero, which is what I needed.