Unlock a world of possibilities! Login now and discover the exclusive benefits awaiting you.
- Qlik Community
- :
- All Forums
- :
- QlikView App Dev
- :
- Re: One table, Two Date Fields
- Subscribe to RSS Feed
- Mark Topic as New
- Mark Topic as Read
- Float this Topic for Current User
- Bookmark
- Subscribe
- Mute
- Printer Friendly Page
- Mark as New
- Bookmark
- Subscribe
- Mute
- Subscribe to RSS Feed
- Permalink
- Report Inappropriate Content
One table, Two Date Fields
Hi,
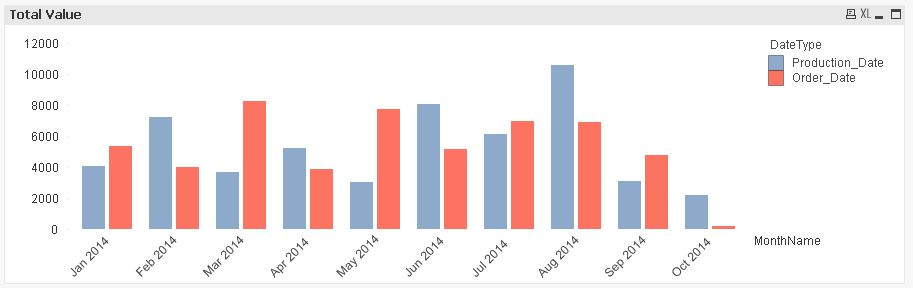
I have a table with two date fields. Those date fields can contain different dates...

and I need to analyze in the same chart like this:

Does anyone have a suggestion?
Thanks!!
- Tags:
- qlikview_scripting
Accepted Solutions
- Mark as New
- Bookmark
- Subscribe
- Mute
- Subscribe to RSS Feed
- Permalink
- Report Inappropriate Content
- Mark as New
- Bookmark
- Subscribe
- Mute
- Subscribe to RSS Feed
- Permalink
- Report Inappropriate Content
Transform the data to a table with only one date field.
Table:
LOAD Cta_number,
Production_Date as Date,
'Production' as Type
Value
FROM ...
Concatenate(Table)
LOAD Cta_number,
Order_Date as Date,
'Order' as Type
Value
FROM ...
Then use Type and Date as dimensions.
talk is cheap, supply exceeds demand
- Mark as New
- Bookmark
- Subscribe
- Mute
- Subscribe to RSS Feed
- Permalink
- Report Inappropriate Content
Hi Gysbert,
Doing this way, all row records are being duplicated...
Any suggestion?
- Mark as New
- Bookmark
- Subscribe
- Mute
- Subscribe to RSS Feed
- Permalink
- Report Inappropriate Content
Yes. Do it.
talk is cheap, supply exceeds demand
- Mark as New
- Bookmark
- Subscribe
- Mute
- Subscribe to RSS Feed
- Permalink
- Report Inappropriate Content
Gysbert Wassenaar is the simpler, another way is
1) creating an data island with a "Date" field.
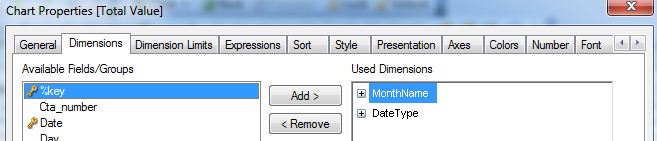
2) using this field as dimension into your graph
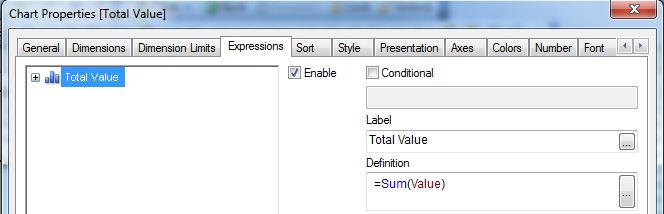
3) Adjust your expressions to 'link' to that new field
- Mark as New
- Bookmark
- Subscribe
- Mute
- Subscribe to RSS Feed
- Permalink
- Report Inappropriate Content
pfa
- Mark as New
- Bookmark
- Subscribe
- Mute
- Subscribe to RSS Feed
- Permalink
- Report Inappropriate Content
Hi,
one solution might be also:
//creation of sample data
tabData:
LOAD RecNo() as %key,
Ceil(Rand()*10) as Cta_number,
Date(Ceil(Rand()*DayNumberOfYear(Today())+YearStart(Today()))) as Production_Date,
Date(Ceil(Rand()*DayNumberOfYear(Today())+YearStart(Today()))) as Order_Date,
Round(Rand()*1000,0.01) as Value
AutoGenerate 100;
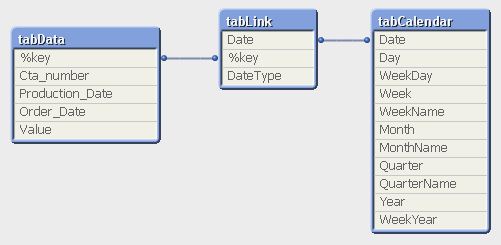
tabLink:
CrossTable (DateType, Date)
LOAD %key,
Production_Date,
Order_Date
Resident tabData;
tabCalendar:
LOAD *,
Day(Date) as Day,
WeekDay(Date) as WeekDay,
Week(Date) as Week,
WeekName(Date) as WeekName,
Month(Date) as Month,
MonthName(Date) as MonthName,
Ceil(Month(Date)/3) as Quarter,
QuarterName(Date) as QuarterName,
Year(Date) as Year,
WeekYear(Date) as WeekYear;
LOAD Date(MinDate+IterNo()-1) as Date
While MinDate+IterNo()-1<=Today();
LOAD RangeMin(Min(Production_Date),Min(Order_Date)) as MinDate
Resident tabData;
hope this helps
regards
Marco
- Mark as New
- Bookmark
- Subscribe
- Mute
- Subscribe to RSS Feed
- Permalink
- Report Inappropriate Content
Thank you Clever!
Works fine!