Unlock a world of possibilities! Login now and discover the exclusive benefits awaiting you.
- Qlik Community
- :
- All Forums
- :
- QlikView App Dev
- :
- Overlapping dates
- Subscribe to RSS Feed
- Mark Topic as New
- Mark Topic as Read
- Float this Topic for Current User
- Bookmark
- Subscribe
- Mute
- Printer Friendly Page
- Mark as New
- Bookmark
- Subscribe
- Mute
- Subscribe to RSS Feed
- Permalink
- Report Inappropriate Content
Overlapping dates
Hi all
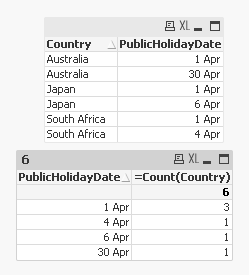
I am working on public holidays in different countries and I need to create a chart or table showing the overlapping dates for each country. So basically I have countries and a set of public holiday dates, I need to show the dates on which the countries share a public holiday. So for example:
Country PublicHolidayDate
South Africa 1 Apr
South Africa 4 Apr
Japan 1 Apr
Japan 6 Apr
Australia 1 Apr
Australia 30 Apr
(I need to thus create a chart/table showing the overlapping date (1 Apr) and count the countries that share that date)
Displaying this table:
Number of countries PublicHolidayDate
3 1 Apr
1 4 Apr
1 6 Apr
1 30 Apr
Any help would be highly appreciated 
Accepted Solutions
- Mark as New
- Bookmark
- Subscribe
- Mute
- Subscribe to RSS Feed
- Permalink
- Report Inappropriate Content
- Mark as New
- Bookmark
- Subscribe
- Mute
- Subscribe to RSS Feed
- Permalink
- Report Inappropriate Content
This?
- Mark as New
- Bookmark
- Subscribe
- Mute
- Subscribe to RSS Feed
- Permalink
- Report Inappropriate Content
Create the Straight Table
Dimension: PublicHolidayDate
Expression:
Count(Country)
- Mark as New
- Bookmark
- Subscribe
- Mute
- Subscribe to RSS Feed
- Permalink
- Report Inappropriate Content
Thanks it seemed to work 
- Mark as New
- Bookmark
- Subscribe
- Mute
- Subscribe to RSS Feed
- Permalink
- Report Inappropriate Content
to expression Count(Country) and in dimension take the Date column
- Mark as New
- Bookmark
- Subscribe
- Mute
- Subscribe to RSS Feed
- Permalink
- Report Inappropriate Content
to expression Count(Country) and in dimension take the Date column
- Mark as New
- Bookmark
- Subscribe
- Mute
- Subscribe to RSS Feed
- Permalink
- Report Inappropriate Content
Please close the thread by marking correct or helpful answer