Unlock a world of possibilities! Login now and discover the exclusive benefits awaiting you.
- Qlik Community
- :
- All Forums
- :
- QlikView App Dev
- :
- Overview - How to built?
- Subscribe to RSS Feed
- Mark Topic as New
- Mark Topic as Read
- Float this Topic for Current User
- Bookmark
- Subscribe
- Mute
- Printer Friendly Page
- Mark as New
- Bookmark
- Subscribe
- Mute
- Subscribe to RSS Feed
- Permalink
- Report Inappropriate Content
Overview - How to built?
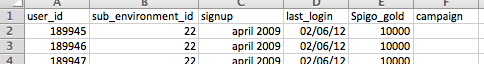
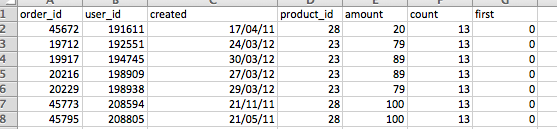
I have an order and a users tabel in my database:
Now on my general overview sheet I want to create a box with some of our key numbers:
(I made a mockup)
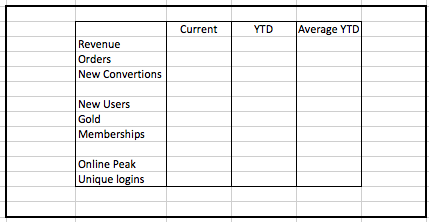
But I can't figure out how to start and which object to use:
I know that:
Revenue = Sum(amount)
Orders = count(distinct(order_id))
New Convertions = sum(first)
New users = count(distinct(user_id)
I have a problem figuring out how to count Gold and Memberships because these should display the overall number on a specific day(where the other show the number for that day)
- How many users are gold & how many memberships are active
How do I get started and what object do I use?
- « Previous Replies
-
- 1
- 2
- Next Replies »
- Mark as New
- Bookmark
- Subscribe
- Mute
- Subscribe to RSS Feed
- Permalink
- Report Inappropriate Content
>because these should display the overall number on a specific day(where the other show the number for that day)
I don't understand this. Do you mean you want to show accumulated data vs. data for that day? Then I would not show that in the same table column 'Current', this might be quite confusing. How do you define Gold?
I assume it has something to do with field Spigo_gold, but just guessing.
Your membership is probably defined by signup (but is there also a potential sign out date that we need to consider?).
It would be best if you can post some lines of sample data (but in an excel or INLINE code table), or a small sample Qv app. And then create an excel table with your expected outcome and attach it also.
Regards,
Stefan
- Mark as New
- Bookmark
- Subscribe
- Mute
- Subscribe to RSS Feed
- Permalink
- Report Inappropriate Content
Hey Stefan,
Okay I have added the test data in an excel file with the output that I want in qlikview
I haven't calculated the YTD correctly, however it should be understandable.
Thank you for your help!
- Mark as New
- Bookmark
- Subscribe
- Mute
- Subscribe to RSS Feed
- Permalink
- Report Inappropriate Content
spigoworld wrote:
Hey Stefan,
Okay I have added the test data in an excel file with the output that I want in qlikview
I haven't calculated the YTD correctly, however it should be understandable.
Thank you for your help!
Hi Spigoworld
Yours was an interesting challenge which mainly required some set analysis to do your overview. The calendar is the most important piece to calculating overview figures in any dashboard. I started a qvw which you can work further on.
You needed an overview of Revenue for Current which I assume was the current month, YTD and average YTD. My qvw got you started on the first two columns for Revenue, Orders and Conversions so you get the general idea.
For your other overview items such as New Users, Online Peak etc, you need a time baseline to compare it to. For eg for new users, do you mean how many users have signed up since last month or last year? The same applies for Online Peak, new signups etc.
Regarding object use, I would recommend using text boxes for the results and aligning them nicely within a container object. This is mainly because you do not have a dimension to create normal charts against.
Let me know if you understand what I did especially with calendar variables.
Good luck
Jeanne
- Mark as New
- Bookmark
- Subscribe
- Mute
- Subscribe to RSS Feed
- Permalink
- Report Inappropriate Content
Hi Spigoworld,
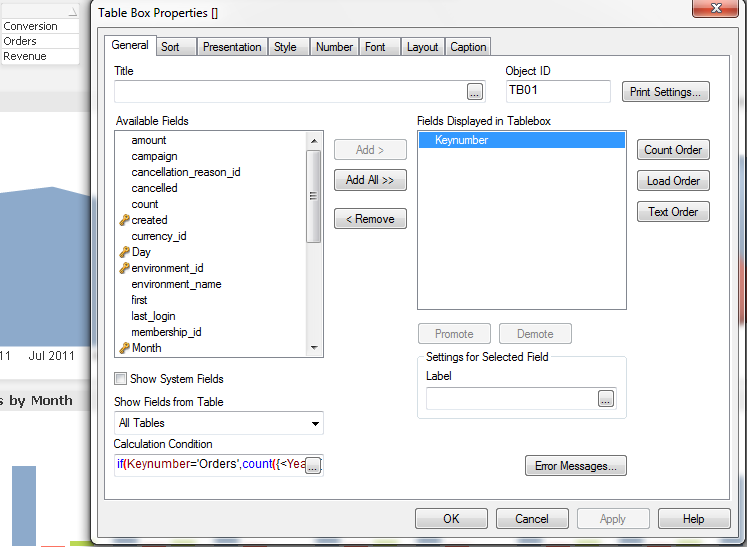
As for the object for your overview i will suggest you something, see if you find it feasible to work upon.
Make an INLINE for your keynumbers(Revenue, Orders,NewConversion etc etc).. Then take a straight table and fetch these keynumbers in the Dimensions tab. Now you have to write the expressions. So make use of ifs and set analysis. There will be 3 expressions in all. 1 for current, 2nd for YTD,3rd for Avg YTD.
Expressions might be something like this.
for YTD:
if
(KeyNumber='Revenue',Sum ({<year = {$(=Max(Year))}>}Fieldname,
if(KeyNumber='Orders',count({<Year={$(=Max(Year))}>}FieldName,
and so on........
) )
- Mark as New
- Bookmark
- Subscribe
- Mute
- Subscribe to RSS Feed
- Permalink
- Report Inappropriate Content
Sorry rupali_a
what would you have me write in the INLINE (first time using it)?
- Mark as New
- Bookmark
- Subscribe
- Mute
- Subscribe to RSS Feed
- Permalink
- Report Inappropriate Content
Hi Spigoworld
Wha rupali_a means is for you to create your own table of "dimensions". Go to script editor, click on Insert -> Load Statement -> Load Inline, fill in the first column like below.
rgds
Jeanne
LOAD * INLINE
[
Keynumber
Revenue
Orders
Conversion
];
- Mark as New
- Bookmark
- Subscribe
- Mute
- Subscribe to RSS Feed
- Permalink
- Report Inappropriate Content
Hi Spigoworld,
Sorry for the delay. Wat Jeanne Petersen is absolutely right. Go to Script editor and make your own table of dimensions.
LOAD INLINE
[
Keynumber
Revenue,
Orders,
Convertion,
New Users,
Gold Memberships.
so on
]
Next take a staight table and fetch the keynumber dimension and write expressions as per your need.
regards
Rupali
- Mark as New
- Bookmark
- Subscribe
- Mute
- Subscribe to RSS Feed
- Permalink
- Report Inappropriate Content
Im new to qlikview
I have done the inline and fetched the keynumbers, however I dont know where to put the expression
I have put the following in Calculation Conditions:
if(Keynumber='Orders',count({<Year={$(=Max(Year))}>}order_id,
if(Keynumber='Conversion',sum({<Year={$(=Max(Year))}>}first,
if(Keynumber='Revenue',sum({<Year={$(=Max(Year))}>}amount,
but no numbers are shown in the table
- Mark as New
- Bookmark
- Subscribe
- Mute
- Subscribe to RSS Feed
- Permalink
- Report Inappropriate Content
Hi spigoworld,
From what I can see in the expression you need to complete the set analysis expression there itself.
eg:
if(Keynumber='Orders',count({<Year={$(=Max(Year))}>} order_id),if.......)
a bracket after order_id is missing. similarly after first and amount.....
- « Previous Replies
-
- 1
- 2
- Next Replies »