Unlock a world of possibilities! Login now and discover the exclusive benefits awaiting you.
- Qlik Community
- :
- All Forums
- :
- QlikView App Dev
- :
- Re: Overview in Pivot Chart
- Subscribe to RSS Feed
- Mark Topic as New
- Mark Topic as Read
- Float this Topic for Current User
- Bookmark
- Subscribe
- Mute
- Printer Friendly Page
- Mark as New
- Bookmark
- Subscribe
- Mute
- Subscribe to RSS Feed
- Permalink
- Report Inappropriate Content
Overview in Pivot Chart
Hi Guys,
I need your help on creating pivot chart. Is it possible to create a chart like below screenshot. I am stuck on this as I am new to qlikview
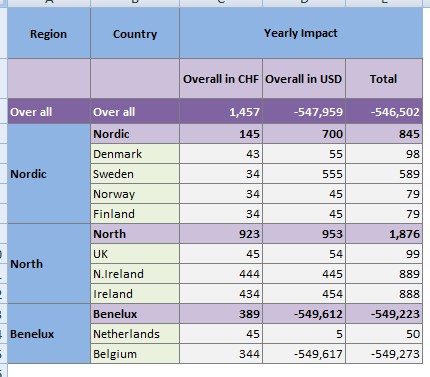
I have attached sample file.
Many thanks in advance
Regards,
Tamil
!
Accepted Solutions
- Mark as New
- Bookmark
- Subscribe
- Mute
- Subscribe to RSS Feed
- Permalink
- Report Inappropriate Content
Tamil,
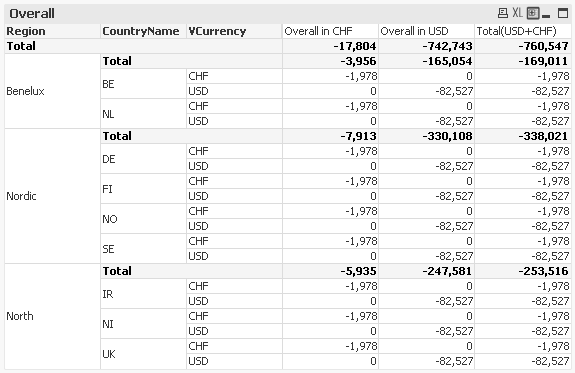
Attached is the solution for your problem. Hope this helps. Here is also a screenshot.Please mark this thread as answered if this solution works for you.
Note: Check Partial sums for the dimensions'Region' and 'CountryName' in presentation tab.
Thanks
- Mark as New
- Bookmark
- Subscribe
- Mute
- Subscribe to RSS Feed
- Permalink
- Report Inappropriate Content
Hi Tamil,
I think you cannot create a chart exactly like shown above. But you can use Pivot Table to show Region and Country(by adding as dimensions) and Overall in CHF,Overall in USD and Total (adding as expressions). But still you cannot show these headings as labels in Pivot Chart.


- Mark as New
- Bookmark
- Subscribe
- Mute
- Subscribe to RSS Feed
- Permalink
- Report Inappropriate Content
Hi Krishna,
That's not a problem. I need to show sub totals for region wise and over all total. Can you tell me how to do. Ill give a try.
- Mark as New
- Bookmark
- Subscribe
- Mute
- Subscribe to RSS Feed
- Permalink
- Report Inappropriate Content
Can you provide me with the sample data or attach .qvw you are using it would be easier to show you.The attached samp.qvw is not a relevant one.
- Mark as New
- Bookmark
- Subscribe
- Mute
- Subscribe to RSS Feed
- Permalink
- Report Inappropriate Content
Here it is. I have added short names for countries. I have multiple excel files, so only I have attached .qvw file. Hope this is okay for you.
!
- Mark as New
- Bookmark
- Subscribe
- Mute
- Subscribe to RSS Feed
- Permalink
- Report Inappropriate Content
Tamil,
Attached is the solution for your problem. Hope this helps. Here is also a screenshot.Please mark this thread as answered if this solution works for you.
Note: Check Partial sums for the dimensions'Region' and 'CountryName' in presentation tab.
Thanks
- Mark as New
- Bookmark
- Subscribe
- Mute
- Subscribe to RSS Feed
- Permalink
- Report Inappropriate Content
Hi Krishna,
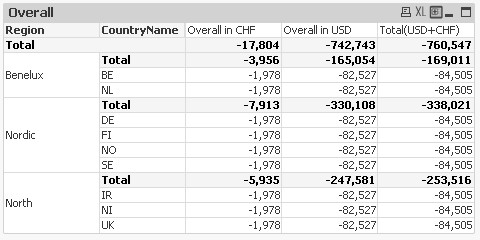
Perfect!! I have removed the vCurrency header from the dimensions and the output is exactly what I was looking.

- Mark as New
- Bookmark
- Subscribe
- Mute
- Subscribe to RSS Feed
- Permalink
- Report Inappropriate Content
Thanks for the emoticon. Happy to know the solution worked for you.