Unlock a world of possibilities! Login now and discover the exclusive benefits awaiting you.
- Qlik Community
- :
- All Forums
- :
- QlikView App Dev
- :
- PIVOT GROUPING / AGGR / SET ANALYSIS
- Subscribe to RSS Feed
- Mark Topic as New
- Mark Topic as Read
- Float this Topic for Current User
- Bookmark
- Subscribe
- Mute
- Printer Friendly Page
- Mark as New
- Bookmark
- Subscribe
- Mute
- Subscribe to RSS Feed
- Permalink
- Report Inappropriate Content
PIVOT GROUPING / AGGR / SET ANALYSIS
Hi All,
I need a help here. I have a dataset as shown below. The data is coming from 2 diffrent source SYS1 and SYS2. The Column SOURCE tells where the record is coming from. and now i have to render this data in pivot table with extra colum as shown below (diagram2)
I.e what is want is if you see Column Output in diagram 2. It should show the from where the data is come from
Example:
A E I S are presenet in both system so Output is SYS1 and SYS2
B G O U olny in SYS2 So output in SYS2
Would you please paste expression here as im not using license version.
| Source | Col1 | Col2 | Col3 | Col4 |
| Sys1 | A | E | I | S |
| Sys2 | A | E | I | S |
| Sys2 | A | E | M | T |
| Sys1 | A | F | N | U |
| Sys2 | B | G | O | P |
| Sys1 | C | H | P | W |
| Sys2 | C | H | P | W |
| Sys1 | C | H | P | X |
| Sys2 | C | H | P | X |
| Sys2 | D | I | Q | Y |
| Sys1 | D | J | R | Z |
| Sys1 | D | K | R | AA |
| Sys2 | D | K | R | AA |
| Level1 | Level2 | Lev2l3 | Level4 | Output |
| A | E | l | S | Sys1, Sys2 |
| M | T | Sys1 | ||
| F | N | U | Sys2 | |
| B | G | O | V | Sys1 |
| C | H | P | W | Sys1,Sys2 |
| C | X | Sys1,Sys2 | ||
| D | I | Q | Y | Sys2 |
| D | J | R | Z | Sys1 |
| D | K | AA | Sys1,Sys2 |
- Mark as New
- Bookmark
- Subscribe
- Mute
- Subscribe to RSS Feed
- Permalink
- Report Inappropriate Content
This is a very straightforward Pivot table without the need for Aggr() nor set expressions:
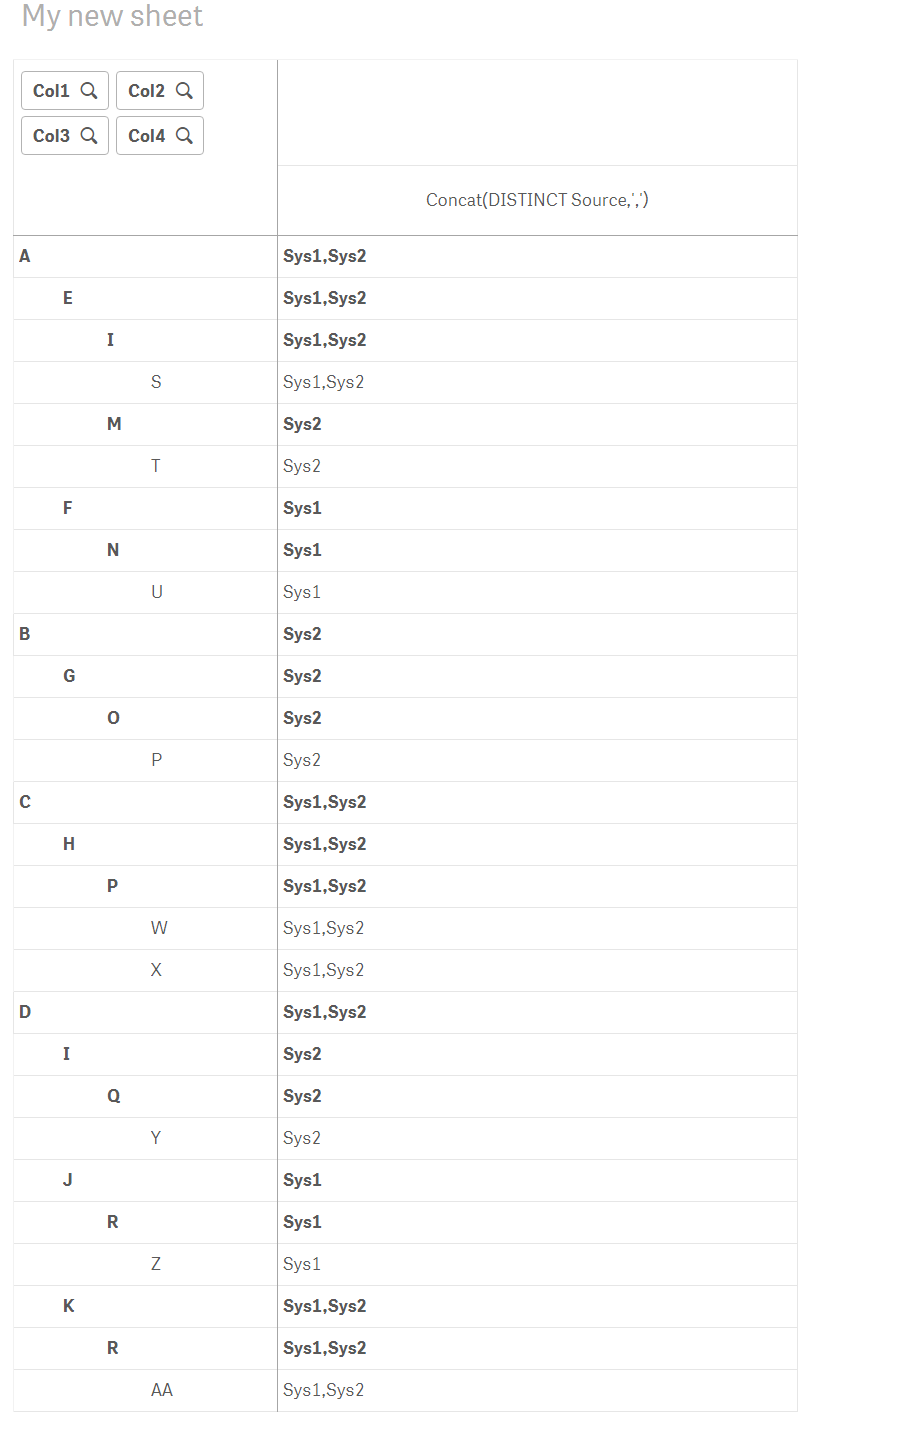
The only thing that might be obvious is the existence of the very handy Concat() function that is a text aggregation function that allows you to take multiple values and aggregate them up to a single string with the selected delimiter.
- Mark as New
- Bookmark
- Subscribe
- Mute
- Subscribe to RSS Feed
- Permalink
- Report Inappropriate Content
Thanks Petter, Ya it helped.
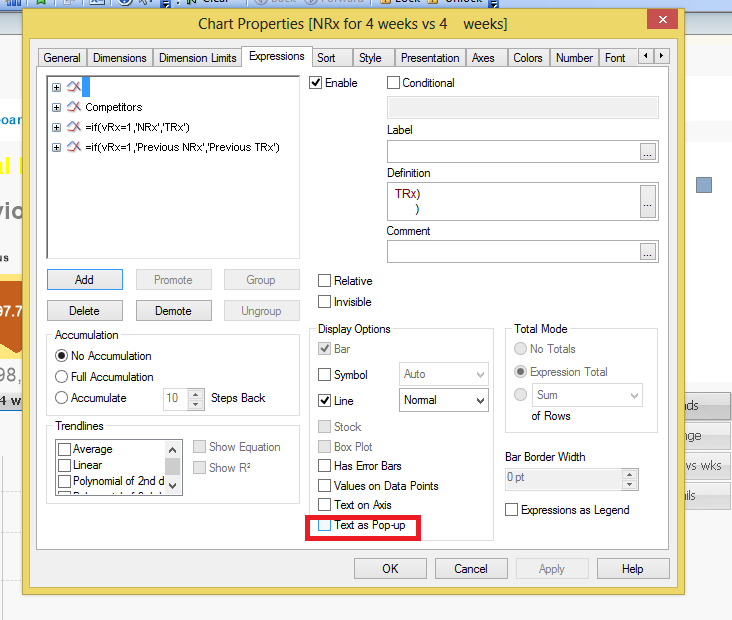
Actually can i show in Popup when i mouse over column Level4?
- Mark as New
- Bookmark
- Subscribe
- Mute
- Subscribe to RSS Feed
- Permalink
- Report Inappropriate Content
If you want a more compact layout and dont need to expand and collapse the levels a normal Table can be used... but you'll have to use a clever trick to format the text of the dimension as white and/or transparent to not get repeating dimension valus in the table....
- Mark as New
- Bookmark
- Subscribe
- Mute
- Subscribe to RSS Feed
- Permalink
- Report Inappropriate Content
This can possible like this: (By default, this cann't possible with pivot or straight tables).
[qlikview type=”exp”]=Customer & chr(10)
& aggr( EmailAddress & chr(10)
& Phone
,Customer )[/qlikview]
Check this: Cell Popups in Straight Table | Qlikview Cookbook
- Mark as New
- Bookmark
- Subscribe
- Mute
- Subscribe to RSS Feed
- Permalink
- Report Inappropriate Content
Other charts have this option: