Unlock a world of possibilities! Login now and discover the exclusive benefits awaiting you.
- Qlik Community
- :
- All Forums
- :
- QlikView App Dev
- :
- Parking lot, peak pr. day
- Subscribe to RSS Feed
- Mark Topic as New
- Mark Topic as Read
- Float this Topic for Current User
- Bookmark
- Subscribe
- Mute
- Printer Friendly Page
- Mark as New
- Bookmark
- Subscribe
- Mute
- Subscribe to RSS Feed
- Permalink
- Report Inappropriate Content
Parking lot, peak pr. day
Dear sirs
I administer a parking lot, and I wish to measure the max/min usage pr. day/hour etc.
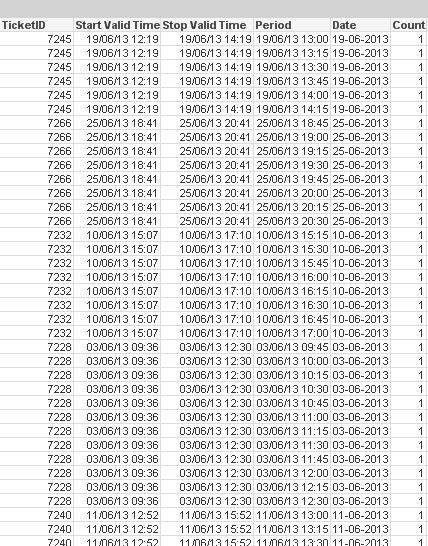
For now I have constructed a table that counts how many cars have parked in a certain time interval (15 mins)
the formula for this is sum(count) and Period is the dimension
So - I can measure the no of cars parked on any given time.
Now i wish to create a chart that shows (with the date as the X-axis)
- average no of parked cars in every 15 min interval throuhout the day
- max of parked cars during the day (pr. 15 min interval)
- min of parked cars during the day
I have some trouble contruction the formulas for this. Can anyone throw a lifeline?
Thanks in advance.
Jesper
- Mark as New
- Bookmark
- Subscribe
- Mute
- Subscribe to RSS Feed
- Permalink
- Report Inappropriate Content
- average no of parked cars in every 15 min interval throuhout the day
- max of parked cars during the day (pr. 15 min interval)
- min of parked cars during the day
For this have dimension as period.
Expression;
1. Sum(Count)/ Sum(total Count)
2. Max(Count)
3. Min(Count)
You need to create a separate chart for each expression.
- Mark as New
- Bookmark
- Subscribe
- Mute
- Subscribe to RSS Feed
- Permalink
- Report Inappropriate Content
Thanks, I was hoping to have all expressions in the same chart.
One solution could be to calculate the max/min values in the script, I would prefer to have en expression based calcualtion though.
Jesper
- Mark as New
- Bookmark
- Subscribe
- Mute
- Subscribe to RSS Feed
- Permalink
- Report Inappropriate Content
No need to calculate Min/max values in the script. if we do this then reload time of script to be high.
- Mark as New
- Bookmark
- Subscribe
- Mute
- Subscribe to RSS Feed
- Permalink
- Report Inappropriate Content
can you please share some sample data
- Mark as New
- Bookmark
- Subscribe
- Mute
- Subscribe to RSS Feed
- Permalink
- Report Inappropriate Content
sure