Unlock a world of possibilities! Login now and discover the exclusive benefits awaiting you.
- Qlik Community
- :
- All Forums
- :
- QlikView App Dev
- :
- Percentage change between days
- Subscribe to RSS Feed
- Mark Topic as New
- Mark Topic as Read
- Float this Topic for Current User
- Bookmark
- Subscribe
- Mute
- Printer Friendly Page
- Mark as New
- Bookmark
- Subscribe
- Mute
- Subscribe to RSS Feed
- Permalink
- Report Inappropriate Content
Percentage change between days
Hi All,
I would like to calculate the percentage change in the script between stock value on different days.
Here is my original data:
What would be a good expression for doing this? I tried this expression but it doesn't work:
FirstSortedValue(Day,Stock Value) - Above(FirstSortedValue(Day,Stock Value) / Above(FirstSortedValue(Day,Stock Value)
Does this make sense?
Accepted Solutions
- Mark as New
- Bookmark
- Subscribe
- Mute
- Subscribe to RSS Feed
- Permalink
- Report Inappropriate Content
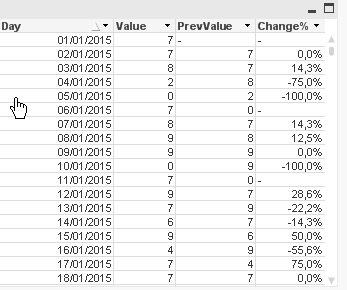
like this?

source: // replace with your data
load
date(makedate(2015) + rowno() -1) as Day,
floor(rand()*10) as Value
AutoGenerate
365;
final:
load
Day,
Value,
Peek(Value) as PrevValue,
(Value - Peek(Value)) / Peek(Value) as Change%
Resident source
order by Day;
- Mark as New
- Bookmark
- Subscribe
- Mute
- Subscribe to RSS Feed
- Permalink
- Report Inappropriate Content
in script or in chart?
if in chart what's the expression for 2nd column (stock value)?
- Mark as New
- Bookmark
- Subscribe
- Mute
- Subscribe to RSS Feed
- Permalink
- Report Inappropriate Content
Stock Value is just a number...no expression for it...same with day...the data above is from my excel file...
I want to edit it in the script if possible..to load the percentage change of stock value from day to day as 'growth rate'....
- Mark as New
- Bookmark
- Subscribe
- Mute
- Subscribe to RSS Feed
- Permalink
- Report Inappropriate Content
like this?

source: // replace with your data
load
date(makedate(2015) + rowno() -1) as Day,
floor(rand()*10) as Value
AutoGenerate
365;
final:
load
Day,
Value,
Peek(Value) as PrevValue,
(Value - Peek(Value)) / Peek(Value) as Change%
Resident source
order by Day;
- Mark as New
- Bookmark
- Subscribe
- Mute
- Subscribe to RSS Feed
- Permalink
- Report Inappropriate Content
Yes thank you very much!
- Mark as New
- Bookmark
- Subscribe
- Mute
- Subscribe to RSS Feed
- Permalink
- Report Inappropriate Content
I think you can do that in chart too; if sum(val) is expression, and the chart is day ordered, above(sum(val))