Unlock a world of possibilities! Login now and discover the exclusive benefits awaiting you.
- Qlik Community
- :
- All Forums
- :
- QlikView App Dev
- :
- Re: Performance Indicators
- Subscribe to RSS Feed
- Mark Topic as New
- Mark Topic as Read
- Float this Topic for Current User
- Bookmark
- Subscribe
- Mute
- Printer Friendly Page
- Mark as New
- Bookmark
- Subscribe
- Mute
- Subscribe to RSS Feed
- Permalink
- Report Inappropriate Content
Performance Indicators
Hi i am new to qlikview, I have been working with excel and I am trying to create a chart with different targets for a group of dimensions and measure but all shown in one chart. This is very simple in excel but I cant fig out how to do it in qlikview. Please find attached the excel chart that i created. If there is a better way to show the same requirement pls guide me.
- Mark as New
- Bookmark
- Subscribe
- Mute
- Subscribe to RSS Feed
- Permalink
- Report Inappropriate Content
Try a combo chart.
talk is cheap, supply exceeds demand
- Mark as New
- Bookmark
- Subscribe
- Mute
- Subscribe to RSS Feed
- Permalink
- Report Inappropriate Content
hie the combo chart joins my target line as one line not seperated as you can see in the image
- Mark as New
- Bookmark
- Subscribe
- Mute
- Subscribe to RSS Feed
- Permalink
- Report Inappropriate Content
use combo chart but seperate the target line into several group may help.
- Mark as New
- Bookmark
- Subscribe
- Mute
- Subscribe to RSS Feed
- Permalink
- Report Inappropriate Content
Something like this might be helpful?
John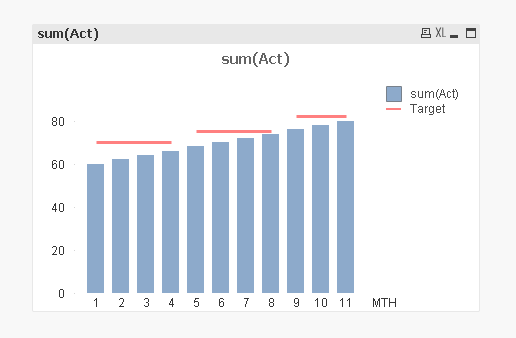
- Mark as New
- Bookmark
- Subscribe
- Mute
- Subscribe to RSS Feed
- Permalink
- Report Inappropriate Content
ok let me try it i see you have done it there, my dimensions have different targets that is why i want it the way you have done it.
Another issue which has not been answered on a different thread but relating to the same chart is the issue of different dimensions, once again very easy in excel. Bar Chart with Two dimension on horizontal axis