Unlock a world of possibilities! Login now and discover the exclusive benefits awaiting you.
- Qlik Community
- :
- All Forums
- :
- QlikView App Dev
- :
- Persistent Colors within Line Chart
- Subscribe to RSS Feed
- Mark Topic as New
- Mark Topic as Read
- Float this Topic for Current User
- Bookmark
- Subscribe
- Mute
- Printer Friendly Page
- Mark as New
- Bookmark
- Subscribe
- Mute
- Subscribe to RSS Feed
- Permalink
- Report Inappropriate Content
Persistent Colors within Line Chart
Hi All,
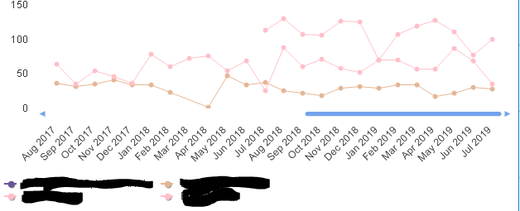
I'm pretty new to Qlik View, and I've seen multiple posts in regards to a persistent color problems, but none have been able to help me solve my current situation. Below I attached a screenshot of my current line chart. When selecting multiple fields, with the persistent colors selected, ignores my calculated colors, and creates it's own. In addition, it uses the same color for different values, which shouldn't be the case, each line should be a separate color. When deselecting the persistent colors option, my calculated colors come back through, but I still need the colors to remain the same if a customer chooses to drill down based on their selection.
Has anyone else ran into this problem? If so, how do you go about fixing it?
Thank you!
Rose
- Mark as New
- Bookmark
- Subscribe
- Mute
- Subscribe to RSS Feed
- Permalink
- Report Inappropriate Content
In the Expression page of the chart, under the expression click background color and you can use a formula to set the color of the lines. For instance. =if ([Dimension] = 'A', green(), if ([Dimension] = 'B', blue(), red()))
This will then keep the same colors no matter what is selected.
- Mark as New
- Bookmark
- Subscribe
- Mute
- Subscribe to RSS Feed
- Permalink
- Report Inappropriate Content
I am using version 12.10 and I don't see that issue. What is your version number ?
- Mark as New
- Bookmark
- Subscribe
- Mute
- Subscribe to RSS Feed
- Permalink
- Report Inappropriate Content
I am using version 12.20. The issue only arises on one line chart that has to do with Providers. So when multiple Providers are selected, each should have their own color, but they are repeating and not starting at the first calculated color.
- Mark as New
- Bookmark
- Subscribe
- Mute
- Subscribe to RSS Feed
- Permalink
- Report Inappropriate Content
One suggestion is, to re create a new chart and see if it works. The reason I am saying this is because in the past I had several issues where the chart doesn't do what you expect. When I re-created the chart then it used to work. May be the chart is corrupted. Give a try and see if that help...
- Mark as New
- Bookmark
- Subscribe
- Mute
- Subscribe to RSS Feed
- Permalink
- Report Inappropriate Content
Rose, not sure if this will help or not:
https://community.qlik.com/t5/Qlik-Design-Blog/Colors-in-charts/ba-p/1475280
Feel free to back the URL up to the Qlik-Design-Blog/ location and do some searching yourself there, as there are some other posts, this one looked like it might be the most useful for your use case, but not sure about line v bar chart settings etc.
Regards,
Brett
I now work a compressed schedule, Tuesday, Wednesday and Thursday, so those will be the days I will reply to any follow-up posts.
