Unlock a world of possibilities! Login now and discover the exclusive benefits awaiting you.
- Qlik Community
- :
- All Forums
- :
- QlikView App Dev
- :
- Pie Matrix: error "drawing of chart failed interna...
- Subscribe to RSS Feed
- Mark Topic as New
- Mark Topic as Read
- Float this Topic for Current User
- Bookmark
- Subscribe
- Mute
- Printer Friendly Page
- Mark as New
- Bookmark
- Subscribe
- Mute
- Subscribe to RSS Feed
- Permalink
- Report Inappropriate Content
Pie Matrix: error "drawing of chart failed internally"
Hello, I want to print in a report a simple Pie Matrix like the one in the following example, reporting Turnover of Fruit over Years
| Pie Matrix Test |
|---|
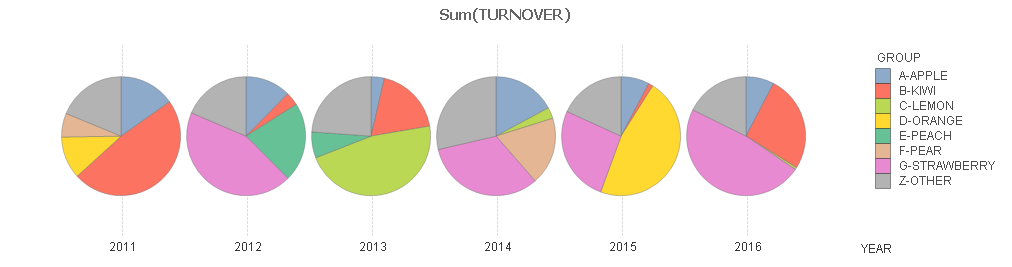 |
My Graph solution is in the attached example. I built it using a calculated dimension, value=1 constant.
The graph is showed correctly in the application but unfortunately it is not possible to print it, due to error "drawing of chart failed internally".
I tested this on:
- Version 11.20.12904.0 SR2 64-bit Edition
- Version 12.0.20001.0 sr1 64-bit Edition
The error is present in both versions.
Any suggestion to solve this annoying problem?
Thank you,
- Tags:
- chart
- error_chart
- pie
- Mark as New
- Bookmark
- Subscribe
- Mute
- Subscribe to RSS Feed
- Permalink
- Report Inappropriate Content
As far as I see, the issue is not depending on your dimensions (it also fails with a different data model), but with the pie charts. If you change the style, it should be printable.
Seems like a bug to me, have you already contacted support?
- Mark as New
- Bookmark
- Subscribe
- Mute
- Subscribe to RSS Feed
- Permalink
- Report Inappropriate Content
No, I haven't. I will do it. Thanks.