Unlock a world of possibilities! Login now and discover the exclusive benefits awaiting you.
- Qlik Community
- :
- All Forums
- :
- QlikView App Dev
- :
- Re: Re: Pie chart (range of values)
- Subscribe to RSS Feed
- Mark Topic as New
- Mark Topic as Read
- Float this Topic for Current User
- Bookmark
- Subscribe
- Mute
- Printer Friendly Page
- Mark as New
- Bookmark
- Subscribe
- Mute
- Subscribe to RSS Feed
- Permalink
- Report Inappropriate Content
Pie chart (range of values)
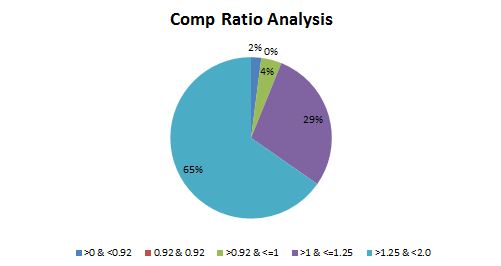
Can any one help, how to prepare this chart
Thanks in advance,
Pavan.
- « Previous Replies
-
- 1
- 2
- Next Replies »
Accepted Solutions
- Mark as New
- Bookmark
- Subscribe
- Mute
- Subscribe to RSS Feed
- Permalink
- Report Inappropriate Content
In the load script i have this:
Test_Temp:
LOAD * INLINE [
    ID, COMP
    1, "0,4"
    2, "0,5"
    3, "0,92"
    4, 1
    5, "0,99"
    6, "1,2"
    7, "1,3"
    8, "1,95"
    9, "1,9"
    10, "0,4"
    11, "0,5"
    12, "0,92"
    13, 1
    14, "0,99"
    15, "1,2"
    16, "1,3"
    17, 1
    18, "0,99"
    19, "1,2"
    20, "1,3"
    21, 1
    22, "0,99"
    23, "1,2"
    24, "1,3"
    25, 1
    26, "0,99"
    27, "1,2"
    28, "1,3"
];
Test:
LOAD *,
if(COMP>0 and COMP<0.92,'>0 & <0.92',
  if(COMP=0.92,'0.92 & 0.92',
  if(COMP>0.92 and COMP<=1,'>0.92 & <=1',
  if(COMP>1 and COMP<=1.25,'>1 & <=1.25',
  if(COMP>1.25 and COMP<2,'>1.25 & <2'
))))) as CUSTOM
Resident Test_Temp;
DROP Table Test_Temp;
And after reload it, create a pie chart with CUSTOM as Dimension,
and
num(sum(COMP)/sum(TOTAL COMP) ,'#.##0%')
as Expression.
Hope this helps
- Mark as New
- Bookmark
- Subscribe
- Mute
- Subscribe to RSS Feed
- Permalink
- Report Inappropriate Content
Create a Pie Chart whit a Valuelist in dimension
Valuelist('>0 & 0.92','0.92 & 0,92',....)
and a conditional background color for expression...
- Mark as New
- Bookmark
- Subscribe
- Mute
- Subscribe to RSS Feed
- Permalink
- Report Inappropriate Content
hope it helps you
- Mark as New
- Bookmark
- Subscribe
- Mute
- Subscribe to RSS Feed
- Permalink
- Report Inappropriate Content
Can u please tell me in-detail, what to do and how to do.
- Mark as New
- Bookmark
- Subscribe
- Mute
- Subscribe to RSS Feed
- Permalink
- Report Inappropriate Content
look at the attacched example
Hope this helps
MC
- Mark as New
- Bookmark
- Subscribe
- Mute
- Subscribe to RSS Feed
- Permalink
- Report Inappropriate Content
I'm sorry, I can not access qvw file.
I'm using personal edition.
Please post the procedure to be done.
Thanks in Advance,
Pavan.
- Mark as New
- Bookmark
- Subscribe
- Mute
- Subscribe to RSS Feed
- Permalink
- Report Inappropriate Content
In the load script i have this:
Test_Temp:
LOAD * INLINE [
    ID, COMP
    1, "0,4"
    2, "0,5"
    3, "0,92"
    4, 1
    5, "0,99"
    6, "1,2"
    7, "1,3"
    8, "1,95"
    9, "1,9"
    10, "0,4"
    11, "0,5"
    12, "0,92"
    13, 1
    14, "0,99"
    15, "1,2"
    16, "1,3"
    17, 1
    18, "0,99"
    19, "1,2"
    20, "1,3"
    21, 1
    22, "0,99"
    23, "1,2"
    24, "1,3"
    25, 1
    26, "0,99"
    27, "1,2"
    28, "1,3"
];
Test:
LOAD *,
if(COMP>0 and COMP<0.92,'>0 & <0.92',
  if(COMP=0.92,'0.92 & 0.92',
  if(COMP>0.92 and COMP<=1,'>0.92 & <=1',
  if(COMP>1 and COMP<=1.25,'>1 & <=1.25',
  if(COMP>1.25 and COMP<2,'>1.25 & <2'
))))) as CUSTOM
Resident Test_Temp;
DROP Table Test_Temp;
And after reload it, create a pie chart with CUSTOM as Dimension,
and
num(sum(COMP)/sum(TOTAL COMP) ,'#.##0%')
as Expression.
Hope this helps
- Mark as New
- Bookmark
- Subscribe
- Mute
- Subscribe to RSS Feed
- Permalink
- Report Inappropriate Content
Thank you very much.....
Really Great Boss.......
Thanks......
- Mark as New
- Bookmark
- Subscribe
- Mute
- Subscribe to RSS Feed
- Permalink
- Report Inappropriate Content
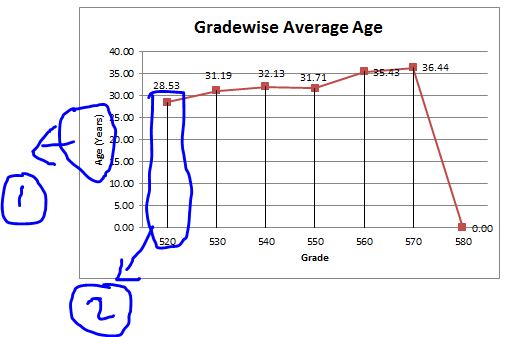
Hi,
Can u please tell me what is the chart type, I tried it on combo chart, but i don't know how to get a thin line instead of bar.
How to get the word "Age (Years)".
Thanks in Advance,
Pavan.
- Mark as New
- Bookmark
- Subscribe
- Mute
- Subscribe to RSS Feed
- Permalink
- Report Inappropriate Content
It's a line chart with Squares Symbol on Expression and whit label of dimension like 'Aged (Years)' and with the orientation in Style tab on orizontal chart.
- « Previous Replies
-
- 1
- 2
- Next Replies »