Unlock a world of possibilities! Login now and discover the exclusive benefits awaiting you.
- Qlik Community
- :
- All Forums
- :
- QlikView App Dev
- :
- Pie charts - group by other
- Subscribe to RSS Feed
- Mark Topic as New
- Mark Topic as Read
- Float this Topic for Current User
- Bookmark
- Subscribe
- Mute
- Printer Friendly Page
- Mark as New
- Bookmark
- Subscribe
- Mute
- Subscribe to RSS Feed
- Permalink
- Report Inappropriate Content
Pie charts - group by other
Hi,
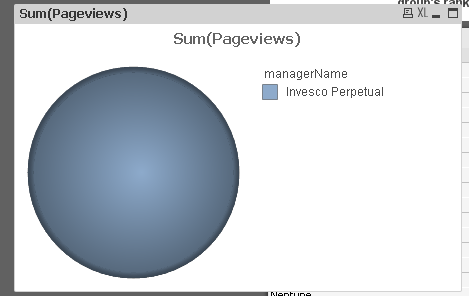
I wonder if you can help. Right now, if I select a company name in my dashboard, the pie chart is updated to show only that company value (like below).
What I would like to do, is be able to show 2 values in the pie chart. The value of the company that has been selected, along with the aggregated value of all other companies - simply marked as 'other'.
Is it possible to do this?
Thanks
- « Previous Replies
-
- 1
- 2
- Next Replies »
Accepted Solutions
- Mark as New
- Bookmark
- Subscribe
- Mute
- Subscribe to RSS Feed
- Permalink
- Report Inappropriate Content
Hi,
try this.
=ValueList('$(=only('Sector'))', 'Others') as dimension and
if(ValueList('$(=only('Sector'))', 'Others') = 'Others',Sum({<Sector=E()>}pageviews),sum(pageviews) )
- Mark as New
- Bookmark
- Subscribe
- Mute
- Subscribe to RSS Feed
- Permalink
- Report Inappropriate Content
Hi kierankeene,
PFA solution, Credits to jason.michaelides
- Mark as New
- Bookmark
- Subscribe
- Mute
- Subscribe to RSS Feed
- Permalink
- Report Inappropriate Content
Hi,
K N is correct follow his example.
- Mark as New
- Bookmark
- Subscribe
- Mute
- Subscribe to RSS Feed
- Permalink
- Report Inappropriate Content
Thank you KN,
Unfortunately, I am still using the personal edition of QV (pending company sign off).
Therefore cannot open the file you sent.The field is called 'Sector' and the calculation is sum(pageviews),
Would you be able to help me out in here?
Thnks
- Mark as New
- Bookmark
- Subscribe
- Mute
- Subscribe to RSS Feed
- Permalink
- Report Inappropriate Content
Hi,
Use this expression in the expression tab,
if(ValueList('$(=only(Sector))', 'Others') = 'Others',Sum({<Sector=E()>}pageviews),sum(pageviews) )
- Mark as New
- Bookmark
- Subscribe
- Mute
- Subscribe to RSS Feed
- Permalink
- Report Inappropriate Content
Thanks Harshitha,
I have added that to the expression field. My dimension is:
=ValueList('$(=only(sector))', 'Others')
However this does not help me filter
Do you know why?
- Mark as New
- Bookmark
- Subscribe
- Mute
- Subscribe to RSS Feed
- Permalink
- Report Inappropriate Content
Hi,
try this.
=ValueList('$(=only('Sector'))', 'Others') as dimension and
if(ValueList('$(=only('Sector'))', 'Others') = 'Others',Sum({<Sector=E()>}pageviews),sum(pageviews) )
- Mark as New
- Bookmark
- Subscribe
- Mute
- Subscribe to RSS Feed
- Permalink
- Report Inappropriate Content
Thanks, I have put that all into the expression and removed my filter from the dimension - is that correct?
If so, I have an 'allocated memory exceeded' error 
- Mark as New
- Bookmark
- Subscribe
- Mute
- Subscribe to RSS Feed
- Permalink
- Report Inappropriate Content
Oh sorry, I see what you mean.
I have set the dimension and the expression and get "no data to display"
- Mark as New
- Bookmark
- Subscribe
- Mute
- Subscribe to RSS Feed
- Permalink
- Report Inappropriate Content
You cant remove the filter in the dimension can you share your qvw file so that i can check it.
Thanks
Harshitha
- « Previous Replies
-
- 1
- 2
- Next Replies »