Unlock a world of possibilities! Login now and discover the exclusive benefits awaiting you.
- Qlik Community
- :
- All Forums
- :
- QlikView App Dev
- :
- Pivot Table Aggr and Distinct Help
- Subscribe to RSS Feed
- Mark Topic as New
- Mark Topic as Read
- Float this Topic for Current User
- Bookmark
- Subscribe
- Mute
- Printer Friendly Page
- Mark as New
- Bookmark
- Subscribe
- Mute
- Subscribe to RSS Feed
- Permalink
- Report Inappropriate Content
Pivot Table Aggr and Distinct Help
Hey guys,
I have a pivot table that I am trying to find a way to get the Sum of "On-Time", "In-Full" as well as "On-time and In-full."
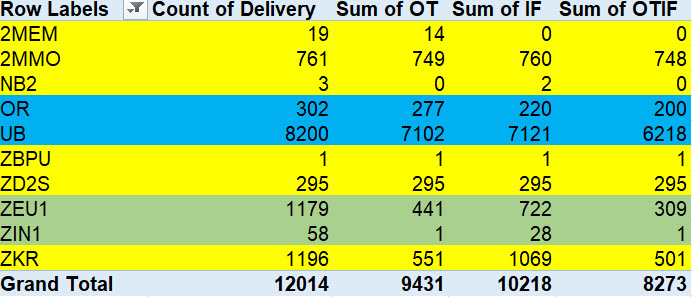
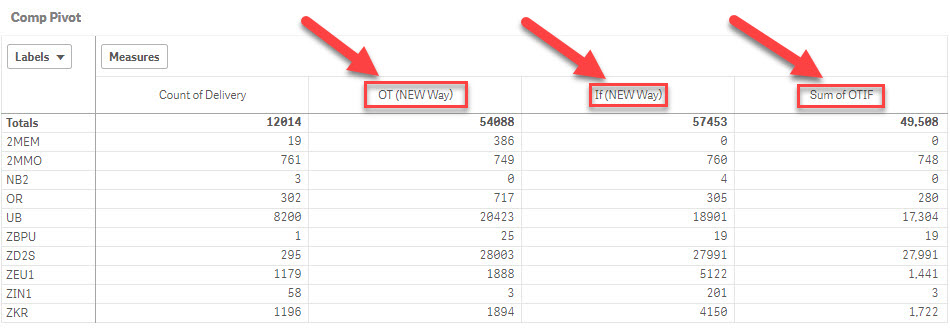
It has taken a lot to get to this point and a lot of help from the community. But I have a raw data file that I am trying to figure out what the percentages of deliveries that are On-Time and In-Full. In the attached excel file, shows the correct output I am trying to reach. In my QV file there are some expressions that I need help with. The raw data shows every item per delivery, not just deliveries. So for the Comp Pivot table, for the count of delivery, I had to do a DISTINCT for the delivery because I was getting 392 rather than the correct 19. For the other calculations I need, is there any way to get the sum based of the distinct deliveries rather than the raw item data. Here is what the output should look like.


And so far, the QV file is almost there, just need to figure out how to get the DISTINCT data per delivery for the following totals.

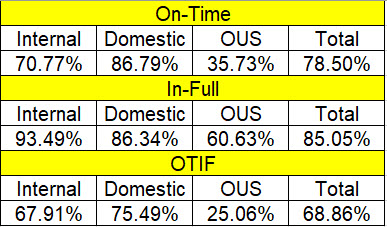
After those are based of the DISTINCT delivery #, I should be able to figure out the percentages below.

- « Previous Replies
- Next Replies »
- Mark as New
- Bookmark
- Subscribe
- Mute
- Subscribe to RSS Feed
- Permalink
- Report Inappropriate Content
The scripting question? Not the one I am looking for.
- Mark as New
- Bookmark
- Subscribe
- Mute
- Subscribe to RSS Feed
- Permalink
- Report Inappropriate Content
Excel formula equivalent in a script? this one I was talking about
- Mark as New
- Bookmark
- Subscribe
- Mute
- Subscribe to RSS Feed
- Permalink
- Report Inappropriate Content
Yeah, the answer that was given on that one, wasn't what I was looking for. I am trying to get a script LOAD so I can manipulate the data as raw data. Currently I have excel running the calculation for me. Essentially, I am trying to get the average Inbound per the user requirement for a specific amount of time.
- Mark as New
- Bookmark
- Subscribe
- Mute
- Subscribe to RSS Feed
- Permalink
- Report Inappropriate Content
provide me the data excel and let me take a look at it
- Mark as New
- Bookmark
- Subscribe
- Mute
- Subscribe to RSS Feed
- Permalink
- Report Inappropriate Content
Give me a moment to consolidate it down. Some data, I am not allowed to share.
- « Previous Replies
- Next Replies »