Unlock a world of possibilities! Login now and discover the exclusive benefits awaiting you.
- Qlik Community
- :
- All Forums
- :
- QlikView App Dev
- :
- Pivot Table Calculated Fields
- Subscribe to RSS Feed
- Mark Topic as New
- Mark Topic as Read
- Float this Topic for Current User
- Bookmark
- Subscribe
- Mute
- Printer Friendly Page
- Mark as New
- Bookmark
- Subscribe
- Mute
- Subscribe to RSS Feed
- Permalink
- Report Inappropriate Content
Pivot Table Calculated Fields
Dear All,
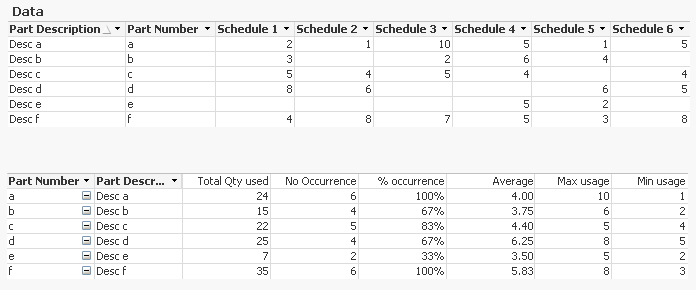
I have got below pivot table produced to show parts usage across different schedule numbers. Dimensions are Part Number, Part Description and Schedule while my expression is sum of used quantity as illustrated below. I have also got Total QTY used per part numbers on column I. When the selections are made number of schedule changes which could go up to 100s.
What I would like to do next is to get calculations shown on column K, L, M, N and O. And I would like to get column K to O right after column B if possible.
No of Occurrence is number of cells that sum (Used QTY) is greater than 0 or not null for the respective part number (I have got pivot table to show null or missing values as 0).
% Occurrence is No of Occurrence / total unique schedule number (6 in below case but changes depending on the selections).
Average usage is average (C to H)
Max Usage is Max (C to H) and Min Usage is Min (C to H).
A | B | C | D | E | F | G | H | I | K | L | M | N | O | |
1 | Part Number | Part Description | Schedule 1 | Schedule 2 | Schedule 3 | Schedule 4 | ... | ... | Total Qty used (C2+H2) | No of Occurrence | % Occurrence | Average usage | Max usage | Min Usage |
2 | a | .. | 2 | 1 | 10 | 5 | 1 | 5 | 24 | 6 | 100% |
| 10 | 1 |
3 | b | .. | 3 | - | 2 | 6 | 4 | - | 15 | 4 | 67% |
| 6 | 2 |
4 | c | .. | 5 | 4 | 5 | 4 | - | 4 | 22 | 5 | 83% |
| 5 | 4 |
5 | d | .. | 8 | 6 | - | - | 6 | 5 | 25 | 4 | 67% |
| 8 | 5 |
6 | e | .. | - | - | - | 5 | 2 | - | 7 | 2 | 33% |
| 5 | 2 |
7 | f | .. | 4 | 8 | 7 | 5 | 3 | 8 | 35 | 6 | 100% |
| 8 | 3 |
Hope it is clear. Many thanks for all the support in advance.
- Mark as New
- Bookmark
- Subscribe
- Mute
- Subscribe to RSS Feed
- Permalink
- Report Inappropriate Content
Please take a look at the attached qvw.
- Mark as New
- Bookmark
- Subscribe
- Mute
- Subscribe to RSS Feed
- Permalink
- Report Inappropriate Content
Hi Alberto,
Thanks for your response. I am unable to open qvw attachments. Is there another way you can show me what needs to be done?
Also, seems like you have taken my table as a simple table and made a pivot or straight table based on it if I am correct. However the table illustrated in my question is already a pivot table. I have to add the required calculations in it. Please confirm if that is correct.
Many thanks
- Mark as New
- Bookmark
- Subscribe
- Mute
- Subscribe to RSS Feed
- Permalink
- Report Inappropriate Content
You are correct I loaded the data as it was shown on the image. Can you post a small sample of data in order to validate the structure? then I can share with you the expressions as text...
- Mark as New
- Bookmark
- Subscribe
- Mute
- Subscribe to RSS Feed
- Permalink
- Report Inappropriate Content
Hi Alberto,
Here below is a small sample of data.
Thanks
| Part Number | Part Description | Used QTY | Schedule Number |
| 1 | a | 8 | SCHEDULE 1 |
| 2 | b | 6 | SCHEDULE 1 |
| 3 | c | 10 | SCHEDULE 1 |
| 4 | d | 2 | SCHEDULE 1 |
| 5 | e | 1 | SCHEDULE 1 |
| 6 | f | 1 | SCHEDULE 1 |
| 7 | g | 4 | SCHEDULE 1 |
| 8 | h | 1 | SCHEDULE 1 |
| 9 | i | 2 | SCHEDULE 1 |
| 10 | j | 1 | SCHEDULE 1 |
| 11 | k | 1 | SCHEDULE 1 |
| 12 | l | 1 | SCHEDULE 1 |
| 13 | m | 2 | SCHEDULE 1 |
| 14 | n | 1 | SCHEDULE 1 |
| 15 | o | 1 | SCHEDULE 1 |
| 16 | p | 9 | SCHEDULE 1 |
| 17 | q | 4 | SCHEDULE 1 |
| 18 | r | 3 | SCHEDULE 1 |
| 19 | s | 14 | SCHEDULE 1 |
| 20 | t | 3 | SCHEDULE 1 |
| 1 | a | 4 | SCHEDULE 2 |
| 2 | b | 1 | SCHEDULE 2 |
| 3 | c | 4 | SCHEDULE 2 |
| 4 | d | 2 | SCHEDULE 2 |
| 5 | e | 4 | SCHEDULE 2 |
| 6 | f | 4 | SCHEDULE 2 |
| 7 | g | 4 | SCHEDULE 2 |
| 8 | h | 1 | SCHEDULE 2 |
| 9 | i | 3 | SCHEDULE 2 |
| 10 | j | 4 | SCHEDULE 2 |
| 11 | k | 4 | SCHEDULE 2 |
| 12 | l | 4 | SCHEDULE 2 |
| 13 | m | 1 | SCHEDULE 2 |
| 14 | n | 3 | SCHEDULE 2 |
| 1 | a | 4 | SCHEDULE 3 |
| 2 | b | 4 | SCHEDULE 3 |
| 3 | c | 1 | SCHEDULE 3 |
| 4 | d | 1 | SCHEDULE 3 |
| 5 | e | 4 | SCHEDULE 3 |
| 6 | f | 2 | SCHEDULE 3 |
| 7 | g | 2 | SCHEDULE 3 |
| 8 | h | 3 | SCHEDULE 3 |
| 9 | i | 1 | SCHEDULE 3 |
| 10 | j | 4 | SCHEDULE 3 |
| 11 | k | 8 | SCHEDULE 3 |
| 12 | l | 4 | SCHEDULE 3 |
| 13 | m | 4 | SCHEDULE 3 |
| 14 | n | 4 | SCHEDULE 3 |
| 15 | o | 2 | SCHEDULE 3 |
| 16 | p | 5 | SCHEDULE 3 |
| 17 | q | 4 | SCHEDULE 3 |
| 1 | a | 4 | SCHEDULE 4 |
| 2 | b | 20 | SCHEDULE 4 |
| 3 | c | 1 | SCHEDULE 4 |
| 4 | d | 2 | SCHEDULE 4 |
| 5 | e | 1 | SCHEDULE 4 |
| 6 | f | 4 | SCHEDULE 4 |
| 7 | g | 50 | SCHEDULE 4 |
| 8 | h | 1 | SCHEDULE 4 |
| 9 | i | 12 | SCHEDULE 4 |
| 10 | j | 28 | SCHEDULE 4 |
| 11 | k | 5 | SCHEDULE 4 |
| 12 | l | 4 | SCHEDULE 4 |
| 13 | m | 2 | SCHEDULE 4 |
| 1 | a | 2 | SCHEDULE 6 |
| 2 | b | 1 | SCHEDULE 6 |
| 3 | c | 25 | SCHEDULE 6 |
| 4 | d | 1 | SCHEDULE 6 |
| 5 | e | 3 | SCHEDULE 6 |
| 6 | f | 5 | SCHEDULE 6 |
| 7 | g | 8 | SCHEDULE 6 |
| 8 | h | 4 | SCHEDULE 6 |
| 9 | i | 1 | SCHEDULE 6 |
| 10 | j | 4 | SCHEDULE 6 |
| 1 | a | 1 | SCHEDULE 5 |
| 2 | b | 1 | SCHEDULE 5 |
| 3 | c | 1 | SCHEDULE 5 |
| 4 | d | 1 | SCHEDULE 5 |
| 5 | e | 2 | SCHEDULE 5 |
| 6 | f | 4 | SCHEDULE 5 |
| 7 | g | 2 | SCHEDULE 5 |
| 8 | h | 40 | SCHEDULE 5 |
| 9 | i | 4 | SCHEDULE 5 |
| 10 | j | 1 | SCHEDULE 5 |
| 11 | k | 1 | SCHEDULE 5 |
| 12 | l | 2 | SCHEDULE 5 |
| 13 | m | 28 | SCHEDULE 5 |
| 14 | n | 1 | SCHEDULE 5 |
| 15 | o | 1 | SCHEDULE 5 |
| 16 | p | 1 | SCHEDULE 5 |
| 1 | a | 2 | SCHEDULE 5 |
| 2 | b | 3 | SCHEDULE 5 |
| 3 | c | 40 | SCHEDULE 5 |
| 4 | d | 4 | SCHEDULE 5 |
| 5 | e | 1 | SCHEDULE 5 |
| 6 | f | 1 | SCHEDULE 5 |
| 7 | g | 3 | SCHEDULE 5 |
| 8 | h | 1 | SCHEDULE 5 |
| 9 | i | 1 | SCHEDULE 5 |
| 10 | j | 1 | SCHEDULE 5 |
| 11 | k | 4 | SCHEDULE 5 |
| 1 | a | 1 | SCHEDULE 5 |
| 2 | b | 1 | SCHEDULE 5 |
| 3 | c | 1 | SCHEDULE 5 |
| 4 | d | 1 | SCHEDULE 5 |
| 5 | e | 1 | SCHEDULE 5 |
| 6 | f | 2 | SCHEDULE 5 |
| 7 | g | 3 | SCHEDULE 5 |
| 8 | h | 20 | SCHEDULE 5 |
| 9 | i | 20 | SCHEDULE 5 |
| 10 | j | 4 | SCHEDULE 5 |
| 11 | k | 1 | SCHEDULE 5 |
| 12 | l | 1 | SCHEDULE 5 |
| 13 | m | 3 | SCHEDULE 5 |
| 14 | n | 1 | SCHEDULE 5 |
- Mark as New
- Bookmark
- Subscribe
- Mute
- Subscribe to RSS Feed
- Permalink
- Report Inappropriate Content
Here's my suggestion:
Total Qty used: Sum([Used QTY])
No Occurrence: RangeSum(count({$<[Used QTY]*={'>0'}>}[Part Number]))
% occurrence: RangeSum(count({$<[Used QTY]*={'>0'}>}[Part Number]))/(Aggr(count([Used QTY]),[Part Number]))
Average: Avg([Used QTY])
Max usage: Max([Used QTY])
Min usage: Min([Used QTY])
- Mark as New
- Bookmark
- Subscribe
- Mute
- Subscribe to RSS Feed
- Permalink
- Report Inappropriate Content
Many thanks Alberto,
I have used the formulas provided as expressions but it gives error. Also once the calculations done they are done for all schedule numbers in pivot table which can go up to 550. This increases the column number to 1100. Is it possible to get these calculations right next to total as one column? Could you please also send me the final qvw file you have managed to achieve the calculations? I will get our team to open it.
Appreciate your help.
Many thanks
Murat
- Mark as New
- Bookmark
- Subscribe
- Mute
- Subscribe to RSS Feed
- Permalink
- Report Inappropriate Content
Please find the qvw for your reference. Note that expressions will need to be adjusted depending on the granularity of your chart but I think it's a good way to get you started.