Unlock a world of possibilities! Login now and discover the exclusive benefits awaiting you.
- Qlik Community
- :
- All Forums
- :
- QlikView App Dev
- :
- Pivot Table Static Expression
- Subscribe to RSS Feed
- Mark Topic as New
- Mark Topic as Read
- Float this Topic for Current User
- Bookmark
- Subscribe
- Mute
- Printer Friendly Page
- Mark as New
- Bookmark
- Subscribe
- Mute
- Subscribe to RSS Feed
- Permalink
- Report Inappropriate Content
Pivot Table Static Expression
Hi,
I have the following table in which I am calculating accuracy for my forecast values against actuals.
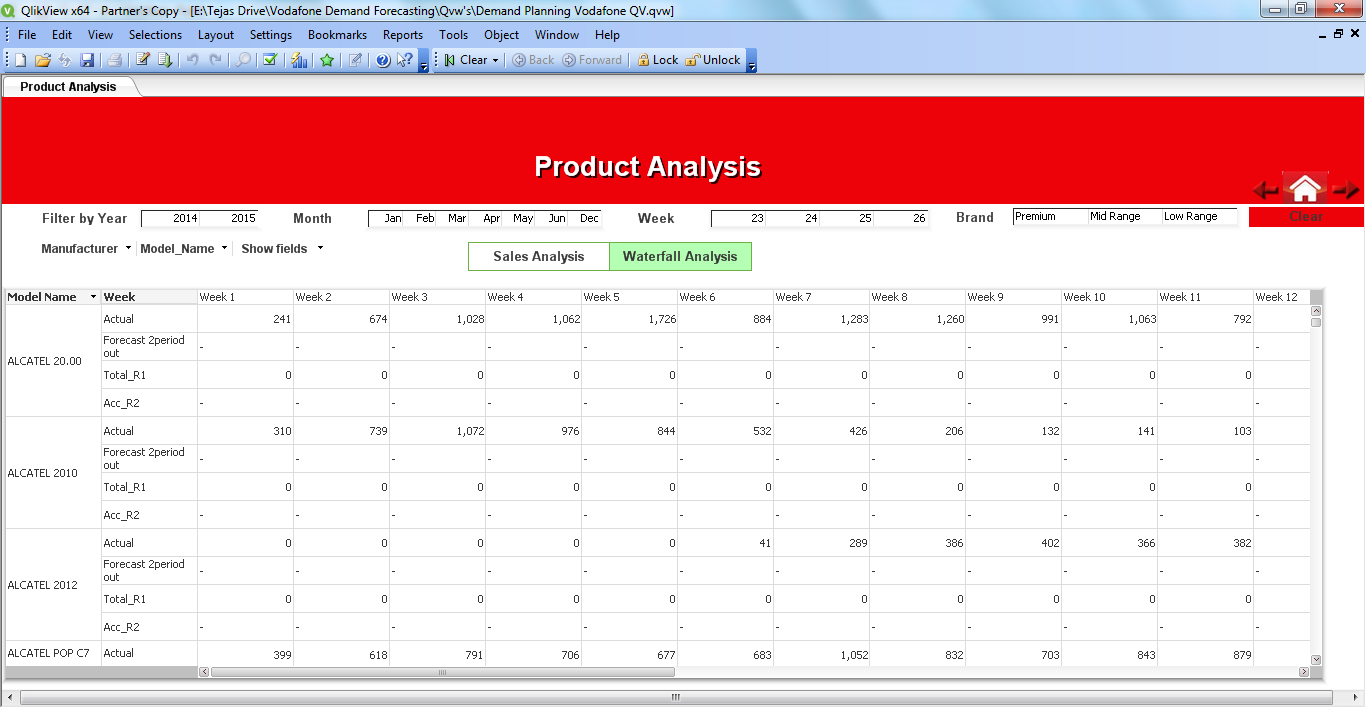
The accuracy is calculated for each week and the formula for accuracy requires me to have the total sales of all products for that week:
Accuracy=
if(Actual<0,0,ALT(1-(fabs(Forecast-Actual)/(If(Forecast >Actual,Forecast,Actual))),0))* (Actual/Total_R1)
where Total_R1 is the sum of sales of all producs for that particular week.
Total_R1=sum(Total<Month_Week>ZUnits_Sold)
Problem 1: The problem with above formula is that whenever I filter my pivot table data, the value of Total_R1 changes accordingly.
however, I want it to remain constant for the accuracy to be correct.
So modified the formula as follows:
Modified Formula:
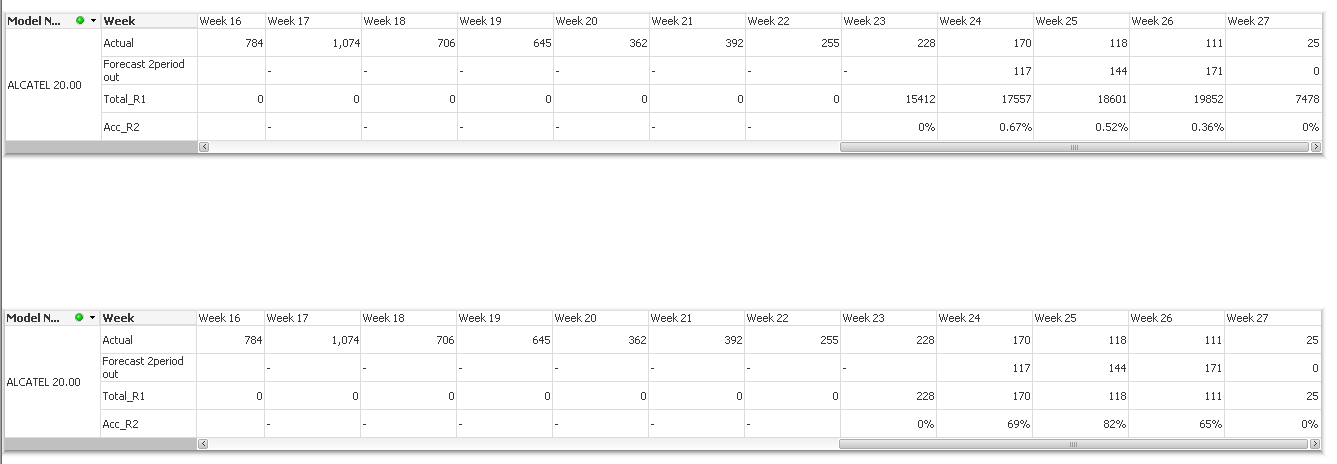
Total_R1=sum({1}Total<Month_Week>ZUnits_Sold)
Problem 2: By modifying the formula this way, any selections I make in the corresponding filters or even the pivot table elements are ignore i.e. data is not filtered. For eg. even if I change the product name, the list of products displayed the the pivot table still remains the same and is shows all entries.
I want the Total_R1 value to remain constant ant also pivot table to respond to selections.
Please suggest a work around.
Request you to refer the attached qvw file.
- Mark as New
- Bookmark
- Subscribe
- Mute
- Subscribe to RSS Feed
- Permalink
- Report Inappropriate Content
I am not 100% sure what the final requirement needs to be, but can you check if this meets your requirement?
Sum({1}Total<Month_Week>ZUnits_Sold) * Avg(1)
- Mark as New
- Bookmark
- Subscribe
- Mute
- Subscribe to RSS Feed
- Permalink
- Report Inappropriate Content
Thanks for the reply Sunny T.
The qvw provided by you is still working the same as my original one.
The accuracy values i get with your formula as well are correct, however due to the identifier {1} is the formula for
Total_R1, the data is not getting filtered for any list box selections.
I want the data to be filtered and respond to list box selection.
For a better picture, you can remove the {1} as follows:
Total_R1=Sum(Total<Month_Week>ZUnits_Sold) * Avg(1)
in your formula and see how the data responds to filter selections as against your with the {1} set identifier.
Hope my requirement is clearer now. Request you to please suggest a way.
- Mark as New
- Bookmark
- Subscribe
- Mute
- Subscribe to RSS Feed
- Permalink
- Report Inappropriate Content
See if this helps:
Not sure why it is behaving the way it is, but when multiplied with Avg({$}1) for all four expression, the chart seems to work the way you want.
- Mark as New
- Bookmark
- Subscribe
- Mute
- Subscribe to RSS Feed
- Permalink
- Report Inappropriate Content
Hi Sunny T,
It seems to work so.
Thanks for the response.
Could you please explain the logic, not able to figure out this particular case.
Thanks,
Tejas
- Mark as New
- Bookmark
- Subscribe
- Mute
- Subscribe to RSS Feed
- Permalink
- Report Inappropriate Content
Like I said, I am not sure why it is behaving the way it is behaving, but my guess is that the expressions getting pivoted might be causing this.
If you got what you wanted, I would suggest closing the thread by marking correct and helpful responses.
Qlik Community Tip: Marking Replies as Correct or Helpful
Best,
Sunny