Unlock a world of possibilities! Login now and discover the exclusive benefits awaiting you.
- Qlik Community
- :
- All Forums
- :
- QlikView App Dev
- :
- Re: Pivot Table - Top 3 WeekDays
- Subscribe to RSS Feed
- Mark Topic as New
- Mark Topic as Read
- Float this Topic for Current User
- Bookmark
- Subscribe
- Mute
- Printer Friendly Page
- Mark as New
- Bookmark
- Subscribe
- Mute
- Subscribe to RSS Feed
- Permalink
- Report Inappropriate Content
Pivot Table - Top 3 WeekDays
Hi,
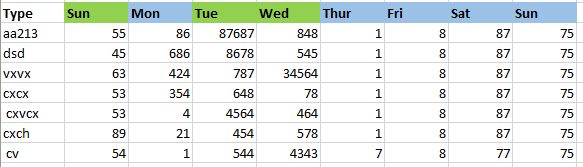
In a Pivot Table I have added Type,Weekday(Sun,Mon,Tue...) as Dimensions and Count(Events) As "Expression".
Now my requirement is have to display Top3 Weekdays as "Green Color" and Remaining weekdays as "Blue color".
Can any one please help me to do.
Thanks.
- « Previous Replies
-
- 1
- 2
- Next Replies »
- Mark as New
- Bookmark
- Subscribe
- Mute
- Subscribe to RSS Feed
- Permalink
- Report Inappropriate Content
It would be good to suggest if you provide the sample.
- Mark as New
- Bookmark
- Subscribe
- Mute
- Subscribe to RSS Feed
- Permalink
- Report Inappropriate Content
May be this:
=If(Sum(Aggr(Count({<CALL_SOURCE={'ANI/ALI','PHONE','WALK-IN'}>} EVENT_NUMBER), CDTS_WeekDay))>= Max(TOTAL Aggr(Count({<CALL_SOURCE={'ANI/ALI','PHONE','WALK-IN'}>}EVENT_NUMBER), CDTS_WeekDay), 3), RGB(155,187,89),RGB(149,179,215))
- Mark as New
- Bookmark
- Subscribe
- Mute
- Subscribe to RSS Feed
- Permalink
- Report Inappropriate Content
=If(SecondaryDimensionality() = 1, If(Count(TOTAL <CDTS_WeekDay>{<CALL_SOURCE={'ANI/ALI','PHONE','WALK-IN'}>} EVENT_NUMBER) >=
Max(TOTAL Aggr(Count({<CALL_SOURCE={'ANI/ALI','PHONE','WALK-IN'}>}EVENT_NUMBER), CDTS_WeekDay), 3),
RGB(155,187,89),RGB(149,179,215)))
- « Previous Replies
-
- 1
- 2
- Next Replies »