Unlock a world of possibilities! Login now and discover the exclusive benefits awaiting you.
- Qlik Community
- :
- All Forums
- :
- QlikView App Dev
- :
- Pivot Table XLS Output
- Subscribe to RSS Feed
- Mark Topic as New
- Mark Topic as Read
- Float this Topic for Current User
- Bookmark
- Subscribe
- Mute
- Printer Friendly Page
- Mark as New
- Bookmark
- Subscribe
- Mute
- Subscribe to RSS Feed
- Permalink
- Report Inappropriate Content
Pivot Table XLS Output
Hello,
I have created a pivot table which shows user ID and the roles assigned to the user ID. I wasn't able to show anything until I added 1 expression. In the Presentation tab, I now have 1 user ID and 1 role ID. I would like to hide ore remove the 2nd role ID and keep the pivot table displaying the user IDs and the roles assigned to the user IDs. My second issue is that when I try and send to XLS, I get a user ID for each role, instead of getting 1 user ID and multiple roles. Any help would be much appreciated.
Thanks in Advance,
-Lenny
- Tags:
- new_to_qlikview
- Mark as New
- Bookmark
- Subscribe
- Mute
- Subscribe to RSS Feed
- Permalink
- Report Inappropriate Content
Delete the expression.
On the Presentation tab, uncheck "Suppress Zero Values".
-Rob
- Mark as New
- Bookmark
- Subscribe
- Mute
- Subscribe to RSS Feed
- Permalink
- Report Inappropriate Content
Thank you Rob...
It's almost working. The only issue now is that when I try to send to XLS, I still get same user ID for the different Role IDs. I would only like to see Column A having 1 user ID and Column B having muliple roles for that user, The way it looks on my dashboard is the way I want it presented in XLS, however it presents itself differently in XLS.
- Mark as New
- Bookmark
- Subscribe
- Mute
- Subscribe to RSS Feed
- Permalink
- Report Inappropriate Content
I don't have that issue when I test, or I'm misunderstanding. Can you post a sample qvw?
-Rob
- Mark as New
- Bookmark
- Subscribe
- Mute
- Subscribe to RSS Feed
- Permalink
- Report Inappropriate Content
I am not sure how to post a sample qvw.
- Mark as New
- Bookmark
- Subscribe
- Mute
- Subscribe to RSS Feed
- Permalink
- Report Inappropriate Content
Below is a picture of the good pivot chart which shows one user ID with either one role or mulitiple roles. 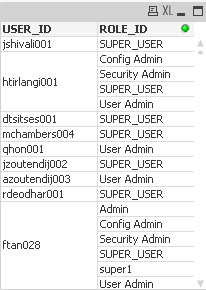
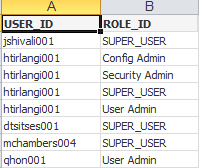
The second picture show the XL output, where the same user ID shows up in each line for the specific role.
I would like to see the output in XL the same as the first picture.
Thanks,
-Lenny