Unlock a world of possibilities! Login now and discover the exclusive benefits awaiting you.
- Qlik Community
- :
- All Forums
- :
- QlikView App Dev
- :
- Re: Pivot Table with bars
- Subscribe to RSS Feed
- Mark Topic as New
- Mark Topic as Read
- Float this Topic for Current User
- Bookmark
- Subscribe
- Mute
- Printer Friendly Page
- Mark as New
- Bookmark
- Subscribe
- Mute
- Subscribe to RSS Feed
- Permalink
- Report Inappropriate Content
Pivot Table with bars
Hey,
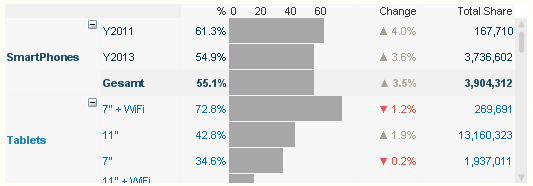
unfortunately I fail creating such a visually looking table:
Data available:
| Companyname | Year | Question1 | Question2 | Question 3 |
|---|---|---|---|---|
| aaa | 2014 | 325 | .. | |
| aaa | 2013 | 321 | ||
| aaa | 2012 | 231 | ||
| bbb | 2014 | 111 | ||
| bbb | 2013 | 222 | ||
| bbb | 2012 | 333 | ... |
And here is the basic idea what to calculate and so on:
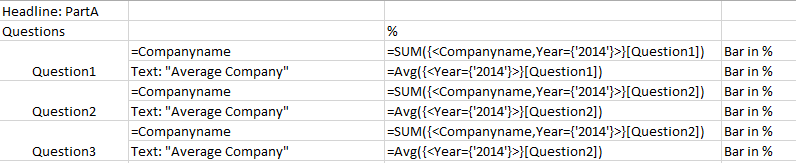
Anyway, no idea how to create such a table that looks like the above...
Many thanks!
Accepted Solutions
- Mark as New
- Bookmark
- Subscribe
- Mute
- Subscribe to RSS Feed
- Permalink
- Report Inappropriate Content
You can transform your excel table using CROSSTABLE into a straight table to match the data model Rob has used:
CrossTable (Question, Answer,2)
LOAD Year,
Companyname,
[Question 1],
[Question 2],
[Question 3],
[Question 4]
FROM
(ooxml, embedded labels, table is Tabelle1)
WHERE Len(trim(Companyname));
- Mark as New
- Bookmark
- Subscribe
- Mute
- Subscribe to RSS Feed
- Permalink
- Report Inappropriate Content
The above screenshot is probably just showing a plain pivot table chart with two dimensions like Category and SubCategory, an expression to show a percentage and next to an expression showing a linear gauge (using display option 'Linear gauge' on expression tab), then two other expressions for change and total share.
You can see a similar example in Rob Wunderlich blog, survey table example:
Pivot Table Grids | Qlikview Cookbook
If you need more help, you would need to post some sample data, best in a small sample QVW.
Hope this helps,
Stefan
- Mark as New
- Bookmark
- Subscribe
- Mute
- Subscribe to RSS Feed
- Permalink
- Report Inappropriate Content
Thanks!
I wanna use the Survey Results grid from Rob Wunderlich.
The issue is that my data set is structured differently and I am not able to configure the table dimensions to visualize the above sample data as it is in Wunderlichs example.
Could anyone try that?
- Mark as New
- Bookmark
- Subscribe
- Mute
- Subscribe to RSS Feed
- Permalink
- Report Inappropriate Content
Could you post a small sample QVW?
- Mark as New
- Bookmark
- Subscribe
- Mute
- Subscribe to RSS Feed
- Permalink
- Report Inappropriate Content
I don´t have any other sample than the one of Rob Wunderlich.
- Mark as New
- Bookmark
- Subscribe
- Mute
- Subscribe to RSS Feed
- Permalink
- Report Inappropriate Content
I am talking about a sample of your data set.
- Mark as New
- Bookmark
- Subscribe
- Mute
- Subscribe to RSS Feed
- Permalink
- Report Inappropriate Content
Find attached some sample data.
- Mark as New
- Bookmark
- Subscribe
- Mute
- Subscribe to RSS Feed
- Permalink
- Report Inappropriate Content
You can transform your excel table using CROSSTABLE into a straight table to match the data model Rob has used:
CrossTable (Question, Answer,2)
LOAD Year,
Companyname,
[Question 1],
[Question 2],
[Question 3],
[Question 4]
FROM
(ooxml, embedded labels, table is Tabelle1)
WHERE Len(trim(Companyname));