Unlock a world of possibilities! Login now and discover the exclusive benefits awaiting you.
- Qlik Community
- :
- All Forums
- :
- QlikView App Dev
- :
- Re: Pivot Table
- Subscribe to RSS Feed
- Mark Topic as New
- Mark Topic as Read
- Float this Topic for Current User
- Bookmark
- Subscribe
- Mute
- Printer Friendly Page
- Mark as New
- Bookmark
- Subscribe
- Mute
- Subscribe to RSS Feed
- Permalink
- Report Inappropriate Content
Pivot Table
Hi
In my QV document I have a pivot table like given below
| FMonth_Year | REVENUE | COST |
| Jul-2015 | 197,629,999 | 115,393,118 |
| Aug-2015 | 205,184,562 | 90,634,108 |
| Sep-2015 | 205,310,127 | 118,830,858 |
| Oct-2015 | 213,414,146 | 116,829,218 |
| Nov-2015 | 210,071,164 | 112,696,709 |
| Dec-2015 | 248,441,458 | 130,523,044 |
| Jan-2016 | 215,390,668 | 113,932,903 |
| Feb-2016 | 222,553,371 | 115,182,775 |
| Mar-2016 | 221,173,065 | 122,596,194 |
| Apr-2016 | 228,302,910 | 112,877,640 |
| May-2016 | 222,898,991 | 116,353,477 |
| Jun-2016 | 231,572,131 | 128,801,425 |
I want to insert columns in this Pivot table which should be as follows
| FMonth_Year | REVENUE | Rev.Increase | COST | Cost Increase |
| Jul-2015 | 197,629,999 | 115,393,118 | ||
| Aug-2015 | 205,184,562 | 7,554,562 | 90,634,108 | (24,759,010) |
| Sep-2015 | 205,310,127 | 125,566 | 118,830,858 | 28,196,750 |
| Oct-2015 | 213,414,146 | 8,104,019 | 116,829,218 | (2,001,640) |
| Nov-2015 | 210,071,164 | (3,342,982) | 112,696,709 | (4,132,509) |
| Dec-2015 | 248,441,458 | 38,370,294 | 130,523,044 | 17,826,335 |
| Jan-2016 | 215,390,668 | (33,050,790) | 113,932,903 | (16,590,141) |
| Feb-2016 | 222,553,371 | 7,162,703 | 115,182,775 | 1,249,872 |
| Mar-2016 | 221,173,065 | (1,380,306) | 122,596,194 | 7,413,419 |
| Apr-2016 | 228,302,910 | 7,129,845 | 112,877,640 | (9,718,553) |
| May-2016 | 222,898,991 | (5,403,920) | 116,353,477 | 3,475,836 |
| Jun-2016 | 231,572,131 | 8,673,140 | 128,801,425 | 12,447,948 |
my expression is as follows
SUM({<DESCRIPTION={'TOTAL_REVENUE'}>}ACTUAL) // for Revenue
SUM({<DESCRIPTION={'COST'}>}ACTUAL) // FOR cost
Pls help me to write expression for revenue increase and cost increse over the last month
- « Previous Replies
-
- 1
- 2
- Next Replies »
Accepted Solutions
- Mark as New
- Bookmark
- Subscribe
- Mute
- Subscribe to RSS Feed
- Permalink
- Report Inappropriate Content
In expression try using this:
=sum(COST) - above(sum(COST))
You should get something like this:
- Mark as New
- Bookmark
- Subscribe
- Mute
- Subscribe to RSS Feed
- Permalink
- Report Inappropriate Content
Hi,
check above() or below() in help it will help you.
Regards
Please appreciate our Qlik community members by giving Kudos for sharing their time for your query. If your query is answered, please mark the topic as resolved 🙂
- Mark as New
- Bookmark
- Subscribe
- Mute
- Subscribe to RSS Feed
- Permalink
- Report Inappropriate Content
Could you please modify my expression
- Mark as New
- Bookmark
- Subscribe
- Mute
- Subscribe to RSS Feed
- Permalink
- Report Inappropriate Content
LOAD Date(date#(FMonth_Year, 'MMM-YYYY'), 'YYYY-MM') as FMonth_Year
     ,replace(REVENUE, ',','') as REVENUE
     ,replace(COST, ',','') as COST
FROM
[https://community.qlik.com/thread/226161]
(html, codepage is 1257, embedded labels, table is @1);
Result:
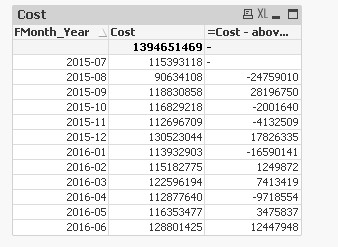
Pivot expression:
=Cost - above(Cost)
Take a look to the attachment.
- Mark as New
- Bookmark
- Subscribe
- Mute
- Subscribe to RSS Feed
- Permalink
- Report Inappropriate Content
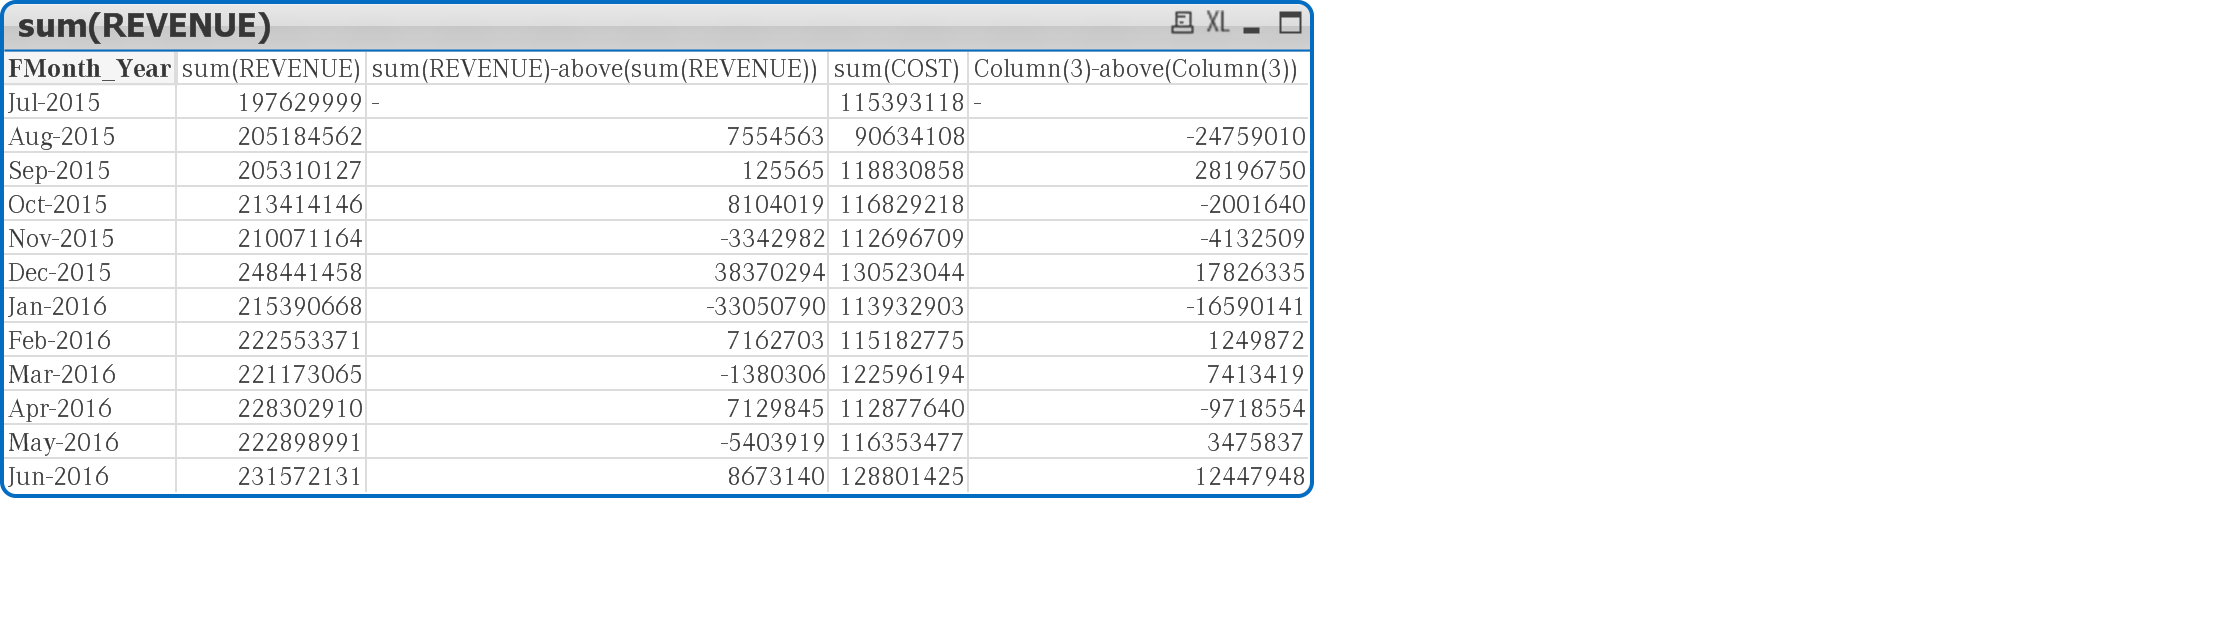
try like this:
- Mark as New
- Bookmark
- Subscribe
- Mute
- Subscribe to RSS Feed
- Permalink
- Report Inappropriate Content
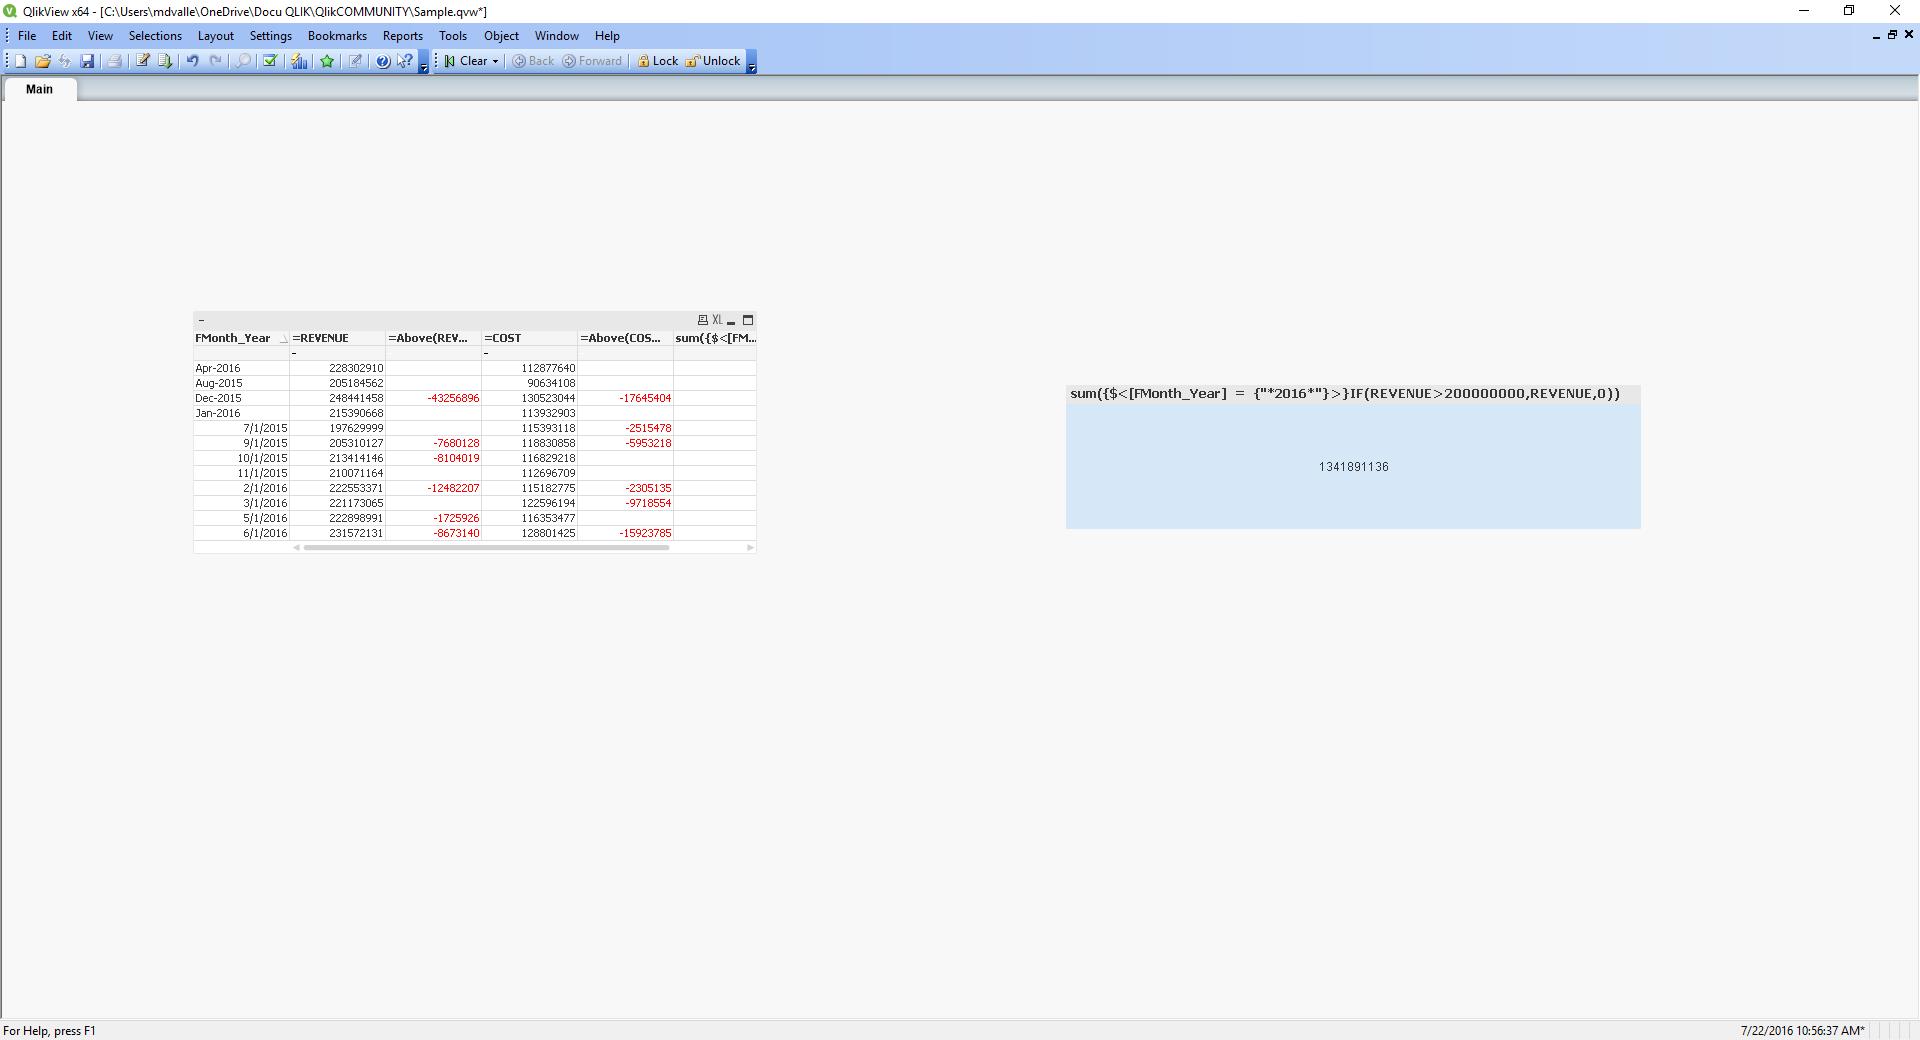
Hi UPali,
Try this example please
Regards
Miguel del Valle
- Mark as New
- Bookmark
- Subscribe
- Mute
- Subscribe to RSS Feed
- Permalink
- Report Inappropriate Content
Thanks Dear
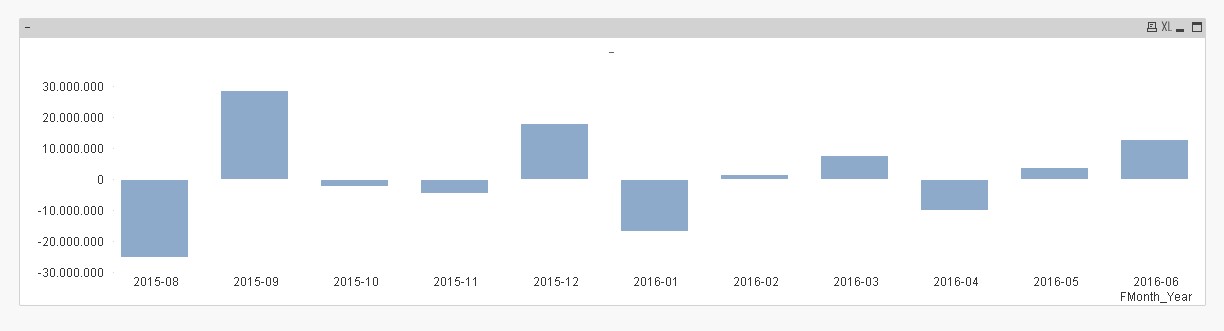
Your answer perfectly match my requirement. But I have one more question That is I want to show the increase amount in Bar Char. I want to show only the increase Amount. Is it possible? if So pls help me
- Mark as New
- Bookmark
- Subscribe
- Mute
- Subscribe to RSS Feed
- Permalink
- Report Inappropriate Content
If you want it in bar chart then In chart property > expression tab > select expression > untick bar.
Regards
Please appreciate our Qlik community members by giving Kudos for sharing their time for your query. If your query is answered, please mark the topic as resolved 🙂
- Mark as New
- Bookmark
- Subscribe
- Mute
- Subscribe to RSS Feed
- Permalink
- Report Inappropriate Content
Like This?
- Mark as New
- Bookmark
- Subscribe
- Mute
- Subscribe to RSS Feed
- Permalink
- Report Inappropriate Content
In expression try using this:
=sum(COST) - above(sum(COST))
You should get something like this:
- « Previous Replies
-
- 1
- 2
- Next Replies »