Unlock a world of possibilities! Login now and discover the exclusive benefits awaiting you.
- Qlik Community
- :
- All Forums
- :
- QlikView App Dev
- :
- Pivot Table
- Subscribe to RSS Feed
- Mark Topic as New
- Mark Topic as Read
- Float this Topic for Current User
- Bookmark
- Subscribe
- Mute
- Printer Friendly Page
- Mark as New
- Bookmark
- Subscribe
- Mute
- Subscribe to RSS Feed
- Permalink
- Report Inappropriate Content
Pivot Table
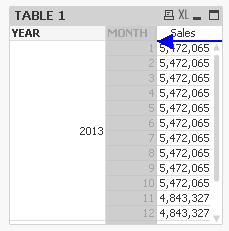
I have created a document (demo) with two Pivot Table .
Table 1 shows data monthly data (both Row & Columns)
Table 2 shows data in monthly columns with one row.
Relationship between these two tables are as follows
In the table 2 data is shown
Under JAN_NRP 4,122,270 (Data from table 1 under JAN_NRP column in the Month 1 row)
Under FEB_NRP 5,225,041 (Data from table 1 under FEB_NRP column in the Month 2 row)
Under JUN_NRP 3,978,719 (Data from table 1 under JUN_NRP column in the Month 6 row) etc
However from Column AUG_NRP onwards this is not working Properly. Eg Under AUG_NRP column (table 2) figure shown is 4,327,208 but correct figure should be 4773933.
I have attached my document and pls help me to rectify this
- Tags:
- app_development
- Mark as New
- Bookmark
- Subscribe
- Mute
- Subscribe to RSS Feed
- Permalink
- Report Inappropriate Content
You are making it much too complicated. Do the following:
1) Load the data using the Crosstable prefix:
http://community.qlik.com/blogs/qlikviewdesignblog/2014/03/24/crosstable
Crosstable (Month, Amount)
Load Year,
JAN_NRP as Jan,
FEB_NRP as Feb, ...
2) Create a pivot table with Year and Month as dimensions and Sum(Amount) as expression.
3) Sort Month according to Load order.
4) Drag and drop the header of "Month" to become a horizontal dimension.
HIC