Unlock a world of possibilities! Login now and discover the exclusive benefits awaiting you.
- Qlik Community
- :
- All Forums
- :
- QlikView App Dev
- :
- Re: Pivot chart help
Options
- Subscribe to RSS Feed
- Mark Topic as New
- Mark Topic as Read
- Float this Topic for Current User
- Bookmark
- Subscribe
- Mute
- Printer Friendly Page
Turn on suggestions
Auto-suggest helps you quickly narrow down your search results by suggesting possible matches as you type.
Showing results for
Contributor III
2014-08-17
01:26 PM
- Mark as New
- Bookmark
- Subscribe
- Mute
- Subscribe to RSS Feed
- Permalink
- Report Inappropriate Content
Pivot chart help
Hi Guys
Please assist me whether its possible to create the pivot chart by following method
11/8/2014 12:00pm | System1 | Feed 11 | Rule1 | Pass | 66% |
Rule2 | Fail | ||||
Rule3 | Pass | ||||
Feed 12 | Rule1 | Pass | 100% | ||
Rule2 | Pass | ||||
12/8/2014 12:00pm | System1 | Feed 11 | Rule1 | Pass | 100% |
Rule2 | Pass | ||||
Rule3 | Pass | ||||
Feed 12 | Rule1 | Fail | 0 | ||
Rule2 | Fail |
629 Views
5 Replies
MVP
2014-08-17
01:29 PM
- Mark as New
- Bookmark
- Subscribe
- Mute
- Subscribe to RSS Feed
- Permalink
- Report Inappropriate Content
Please provide sample data for your above requested result...
Thanks....
530 Views
Contributor III
2014-08-17
01:38 PM
Author
- Mark as New
- Bookmark
- Subscribe
- Mute
- Subscribe to RSS Feed
- Permalink
- Report Inappropriate Content
Here is the sample hope this may helps u !!! Thanks in advance
530 Views
Master II
2014-08-17
01:57 PM
- Mark as New
- Bookmark
- Subscribe
- Mute
- Subscribe to RSS Feed
- Permalink
- Report Inappropriate Content
Is this you want?
Contributor III
2014-08-18
12:19 AM
Author
- Mark as New
- Bookmark
- Subscribe
- Mute
- Subscribe to RSS Feed
- Permalink
- Report Inappropriate Content
Hi Colomer
Thanks , But i need to calculate the Percentage for the Pass & fail based on the Feed..
530 Views
Master II
2014-08-18
01:44 AM
- Mark as New
- Bookmark
- Subscribe
- Mute
- Subscribe to RSS Feed
- Permalink
- Report Inappropriate Content
This one ?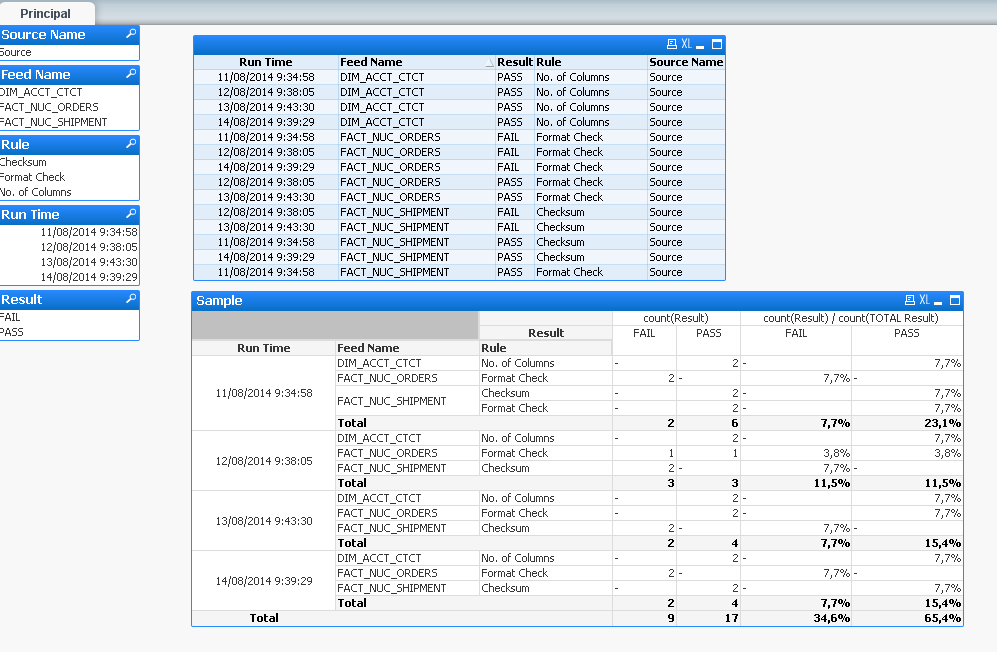
530 Views