Unlock a world of possibilities! Login now and discover the exclusive benefits awaiting you.
- Qlik Community
- :
- All Forums
- :
- QlikView App Dev
- :
- Pivot table problem
- Subscribe to RSS Feed
- Mark Topic as New
- Mark Topic as Read
- Float this Topic for Current User
- Bookmark
- Subscribe
- Mute
- Printer Friendly Page
- Mark as New
- Bookmark
- Subscribe
- Mute
- Subscribe to RSS Feed
- Permalink
- Report Inappropriate Content
Pivot table problem
Hi frieds,
Please help with idea how to show many variable in one pivot table.
Please see below
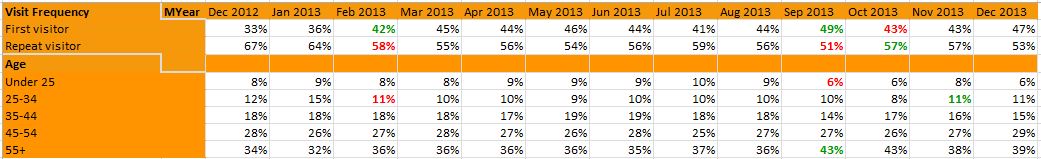
I have variables Visit Frequency (tags: First visitor, Repeat visitor) and Age (tags: Under 25, 25-34 and ...)
I know only use Pivot table
Dimension: MYear
Expression: use set analysis for each tag
Thanks,
- Tags:
- new_to_qlikview
- « Previous Replies
-
- 1
- 2
- Next Replies »
- Mark as New
- Bookmark
- Subscribe
- Mute
- Subscribe to RSS Feed
- Permalink
- Report Inappropriate Content
You can group some together, so that a pivot will be suitable. For example, group months by year and quarter.
- Mark as New
- Bookmark
- Subscribe
- Mute
- Subscribe to RSS Feed
- Permalink
- Report Inappropriate Content
Could you explain more detail how to do it?
Thanks,
- Mark as New
- Bookmark
- Subscribe
- Mute
- Subscribe to RSS Feed
- Permalink
- Report Inappropriate Content
In your data model, using teh script, you can define the grouping by adding an inline table for example. or even better, use a calendar. So you would have a table looking something like this :
Month, Quarter, Year
Dec-2013, 2013Q4, 2013
Jan-2014, 2014Q1, 2014
etc.
Those new fields, Quarter and year could then be used as dimensions in your pivot.
- Mark as New
- Bookmark
- Subscribe
- Mute
- Subscribe to RSS Feed
- Permalink
- Report Inappropriate Content
I don't have problem with MYear.
I don't know how to set up 2 other variable Visit frequency and Age.
It works well, when I use them in separate tables.
Dimension :MYear and Visit frequency
and another pivot table
Dimension: MYear and Age.
I don't know how to combine them in one pivot table.
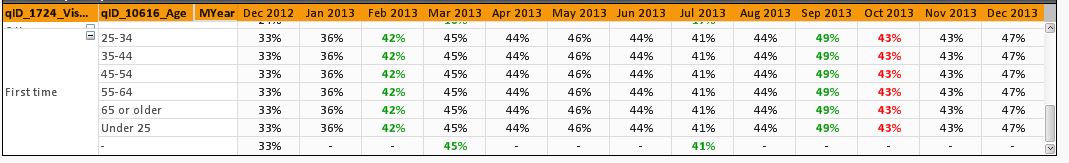
When I add both them in Dimension, I get new level.
- Mark as New
- Bookmark
- Subscribe
- Mute
- Subscribe to RSS Feed
- Permalink
- Report Inappropriate Content
And so they should. if you want them in the same level, the values should belong in the same dimension. So maybe you should concatenate the 2 dimensions into one or create a new dimension combining the values of the 2, something like a link table.
- Mark as New
- Bookmark
- Subscribe
- Mute
- Subscribe to RSS Feed
- Permalink
- Report Inappropriate Content
The problem variables have different total count
- Mark as New
- Bookmark
- Subscribe
- Mute
- Subscribe to RSS Feed
- Permalink
- Report Inappropriate Content
that can also be solved with if statement or set analysis
- Mark as New
- Bookmark
- Subscribe
- Mute
- Subscribe to RSS Feed
- Permalink
- Report Inappropriate Content
how to combine all tags in one variable?
use crosstab?
- Mark as New
- Bookmark
- Subscribe
- Mute
- Subscribe to RSS Feed
- Permalink
- Report Inappropriate Content
please post a sample application if possible
- « Previous Replies
-
- 1
- 2
- Next Replies »