Unlock a world of possibilities! Login now and discover the exclusive benefits awaiting you.
- Qlik Community
- :
- All Forums
- :
- QlikView App Dev
- :
- Pivot table visualization
- Subscribe to RSS Feed
- Mark Topic as New
- Mark Topic as Read
- Float this Topic for Current User
- Bookmark
- Subscribe
- Mute
- Printer Friendly Page
- Mark as New
- Bookmark
- Subscribe
- Mute
- Subscribe to RSS Feed
- Permalink
- Report Inappropriate Content
Pivot table visualization
Hi,
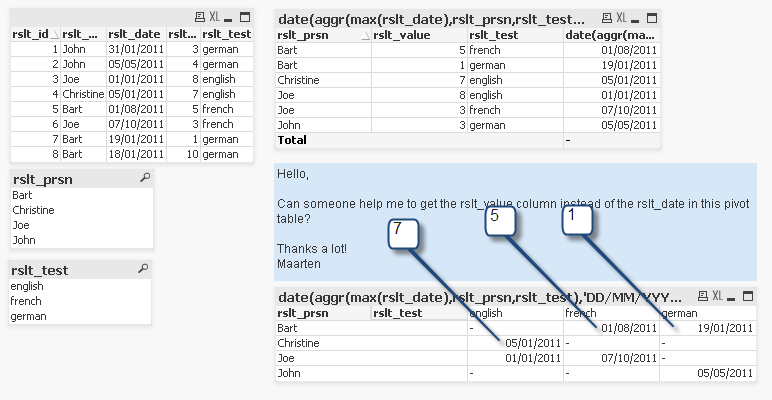
I was wondering if someone of you knows how to replace the dates with the rslt_value in the pivot table shown below.
I've indicated what the resulting value should be.
Probably very easy, but I can't get it to work with a pivot table ( --> above you can see the result without the pivoting)
I used the aggr function for the regular chart
date(aggr(max(rslt_date),rslt_prsn,rslt_test),'DD/MM/YYYY')
but that does not seem to do the trick for me with the pivot table.
Thanks!
Ps: example included as well.
Regards,
Maarten
Accepted Solutions
- Mark as New
- Bookmark
- Subscribe
- Mute
- Subscribe to RSS Feed
- Permalink
- Report Inappropriate Content
HI,
have you tried with something like this?
sum(if(date(aggr(NODISTINCT max(rslt_date),rslt_prsn,rslt_test),'DD/MM/YYYY')=rslt_date,rslt_value))
C u,
Stefano.
- Mark as New
- Bookmark
- Subscribe
- Mute
- Subscribe to RSS Feed
- Permalink
- Report Inappropriate Content
HI,
have you tried with something like this?
sum(if(date(aggr(NODISTINCT max(rslt_date),rslt_prsn,rslt_test),'DD/MM/YYYY')=rslt_date,rslt_value))
C u,
Stefano.
- Mark as New
- Bookmark
- Subscribe
- Mute
- Subscribe to RSS Feed
- Permalink
- Report Inappropriate Content
Excellent solution! 🙂
Thanks Stefano!
Btw: Is it possible to hide the column header "rslt_test" in the pivot table? (I know it is possible with regular chart tables, but the option seems to disappear when going to pivot table. It's just a an empty column ... (or is resizing it the only option :-)).
- Mark as New
- Bookmark
- Subscribe
- Mute
- Subscribe to RSS Feed
- Permalink
- Report Inappropriate Content
U can't hide in pivot, but maybe u want hide only the header otherwise u lose "English, french ,german" dinamic column. If u want hide the header resize and put a space in label in dimension property of the table.
Stefano.
- Mark as New
- Bookmark
- Subscribe
- Mute
- Subscribe to RSS Feed
- Permalink
- Report Inappropriate Content
Thanks! That does look a bit neater 🙂
Have a nice day!!