Unlock a world of possibilities! Login now and discover the exclusive benefits awaiting you.
- Qlik Community
- :
- All Forums
- :
- QlikView App Dev
- :
- Pivot table
- Subscribe to RSS Feed
- Mark Topic as New
- Mark Topic as Read
- Float this Topic for Current User
- Bookmark
- Subscribe
- Mute
- Printer Friendly Page
- Mark as New
- Bookmark
- Subscribe
- Mute
- Subscribe to RSS Feed
- Permalink
- Report Inappropriate Content
Pivot table
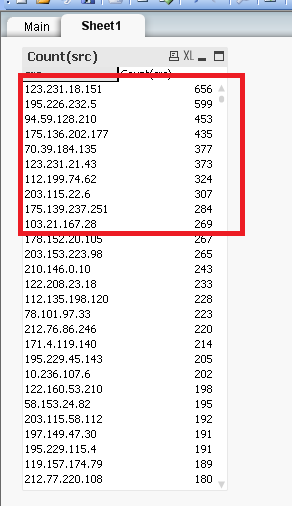
hi i am trying to to display the top 10 highest number of values which is in the pivot table is there any way that i can do this. i have attached an image of the pivot table.
can some one plz help me much appreciated..
thank you in advance 
- « Previous Replies
-
- 1
- 2
- Next Replies »
- Mark as New
- Bookmark
- Subscribe
- Mute
- Subscribe to RSS Feed
- Permalink
- Report Inappropriate Content
You can change the expression, from Count(src) to if(rank(Count(src)<11,Count(src))
Eduardo
- Mark as New
- Bookmark
- Subscribe
- Mute
- Subscribe to RSS Feed
- Permalink
- Report Inappropriate Content
sorry this is not working i am getting an empty table
- Mark as New
- Bookmark
- Subscribe
- Mute
- Subscribe to RSS Feed
- Permalink
- Report Inappropriate Content
can u share ur qvw file?
- Mark as New
- Bookmark
- Subscribe
- Mute
- Subscribe to RSS Feed
- Permalink
- Report Inappropriate Content
Another possibility is to change from pivot table to straight table (considering you have oly one dimension in your table) and check 'Restrict which values are displayed using the first expression, in Dimension Limits tab of the properties of the straight table. Also set 10 as the largest n Values and unmark the Show Others option in the same tab.
Eduardo
- Mark as New
- Bookmark
- Subscribe
- Mute
- Subscribe to RSS Feed
- Permalink
- Report Inappropriate Content
try this in pivot table =if(rank(Sum (src))<=10,sum(src),0)
- Mark as New
- Bookmark
- Subscribe
- Mute
- Subscribe to RSS Feed
- Permalink
- Report Inappropriate Content
Hi Shalani,
Try this:
=aggr(if(Rank(sum(Investment))<=10,Investment),Investment) (For calculating Top 10)
Thanks,
AS
- Mark as New
- Bookmark
- Subscribe
- Mute
- Subscribe to RSS Feed
- Permalink
- Report Inappropriate Content
this gives me the correct answr but i am getting a total count on the 1st row i dnt want that count 😕
- Mark as New
- Bookmark
- Subscribe
- Mute
- Subscribe to RSS Feed
- Permalink
- Report Inappropriate Content
hey this worked but the correct one is =if(rank(Count (src))<=10,Count(src),0)
thank you so much for your help
- Mark as New
- Bookmark
- Subscribe
- Mute
- Subscribe to RSS Feed
- Permalink
- Report Inappropriate Content
is there any possible way of displaying the average next to each count??
- « Previous Replies
-
- 1
- 2
- Next Replies »