Unlock a world of possibilities! Login now and discover the exclusive benefits awaiting you.
- Qlik Community
- :
- All Forums
- :
- QlikView App Dev
- :
- Re: Re: Prefixing a variable with an equals sign
- Subscribe to RSS Feed
- Mark Topic as New
- Mark Topic as Read
- Float this Topic for Current User
- Bookmark
- Subscribe
- Mute
- Printer Friendly Page
- Mark as New
- Bookmark
- Subscribe
- Mute
- Subscribe to RSS Feed
- Permalink
- Report Inappropriate Content
Prefixing a variable with an equals sign
page 188 of qlikview 11 for developers -
Not prefixing the variable expression with an equals sign: When the expression in a variable definition is prefixed with an equals sign (=), the variable gets calculated globally. In our example this would mean that the Load Factor % value is calculated once for the entire data model. When used in a chart, all dimensions would be ignored and the expression would just return the same global value for each dimension. As we obviously do not want this to happen, in this example we do not prefix our expression with an equals sign.
What does this mean ?
- Mark as New
- Bookmark
- Subscribe
- Mute
- Subscribe to RSS Feed
- Permalink
- Report Inappropriate Content
This blog would answer your question: http://community.qlik.com/blogs/qlikviewdesignblog/2013/11/04/the-magic-of-variables
- Mark as New
- Bookmark
- Subscribe
- Mute
- Subscribe to RSS Feed
- Permalink
- Report Inappropriate Content
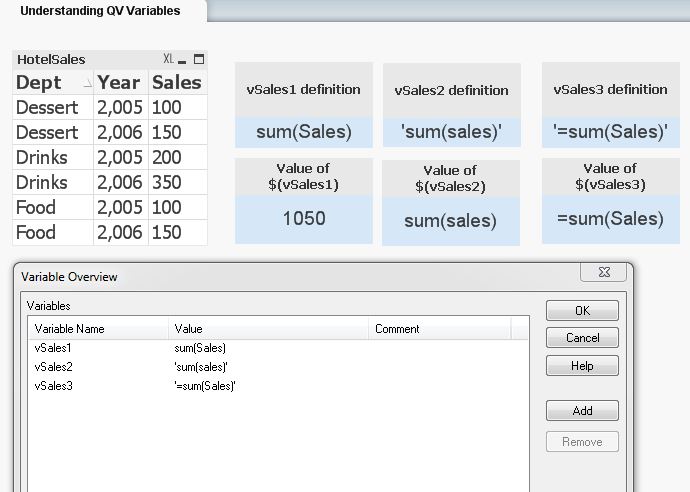
Yes, I had read that a while ago and did not understand because there the author did not provide a sample app. I read it again today and I am still not clear. I am still a beginner and I need a working qvw file which demonstrates the concept. So, I tried making a sample qvw app myself. It is incomplete. Can you help me to complete the example ? Please see the QVW file which I have now attached to my original question.
Here is a screenshot to give you a quick idea of what the qvw file does -

Thanks.
- Mark as New
- Bookmark
- Subscribe
- Mute
- Subscribe to RSS Feed
- Permalink
- Report Inappropriate Content
bounce.
- Mark as New
- Bookmark
- Subscribe
- Mute
- Subscribe to RSS Feed
- Permalink
- Report Inappropriate Content
Hi John,
Can you clarify your question?
It seems as you have created a QVW with different uses for variables.
The use of variables can be very wide, where in some cases you would want it to have a text value, either calculated or constant, and in others it will have a number.
In the example yo have attached, vSales2 and vSales3 are examples of constant text in variables, and the vSales1 variable is an example for a variable which calculates a value, which you can integrate inside any type of chart.
Hope this helps.
Yaniv
- Mark as New
- Bookmark
- Subscribe
- Mute
- Subscribe to RSS Feed
- Permalink
- Report Inappropriate Content
- Mark as New
- Bookmark
- Subscribe
- Mute
- Subscribe to RSS Feed
- Permalink
- Report Inappropriate Content
Yaniv Gold wrote:
The use of variables can be very wide, where in some cases you would want it to have a text value, either calculated or constant, and in others it will have a number.
Can you make an object which will show the effects of having different types of values in a variable such as text value (calculated or constant), numbers ? Unfortunately, the henric blog does not have a qvw from which I actually see the example in action. So, I was trying to make a similar example and I need help to complete it. This example should demonstrate all the concepts shown in the third image (from top) at this link -
http://community.qlik.com/blogs/qlikviewdesignblog/2013/11/04/the-magic-of-variables
Makes sense ?
- Mark as New
- Bookmark
- Subscribe
- Mute
- Subscribe to RSS Feed
- Permalink
- Report Inappropriate Content
Have just added a staright table in your sample qvw. Hope it clears your doubt.