Unlock a world of possibilities! Login now and discover the exclusive benefits awaiting you.
- Qlik Community
- :
- All Forums
- :
- QlikView App Dev
- :
- Price Point issue
- Subscribe to RSS Feed
- Mark Topic as New
- Mark Topic as Read
- Float this Topic for Current User
- Bookmark
- Subscribe
- Mute
- Printer Friendly Page
- Mark as New
- Bookmark
- Subscribe
- Mute
- Subscribe to RSS Feed
- Permalink
- Report Inappropriate Content
Price Point issue
Hi
I have a column name AvgPrice

I want to differentiate 5, 7, 9,10,11 like this price point

Pls help
- Mark as New
- Bookmark
- Subscribe
- Mute
- Subscribe to RSS Feed
- Permalink
- Report Inappropriate Content
Not sure I understand what you are trying to do. Can you elaborate a little more?
- Mark as New
- Bookmark
- Subscribe
- Mute
- Subscribe to RSS Feed
- Permalink
- Report Inappropriate Content
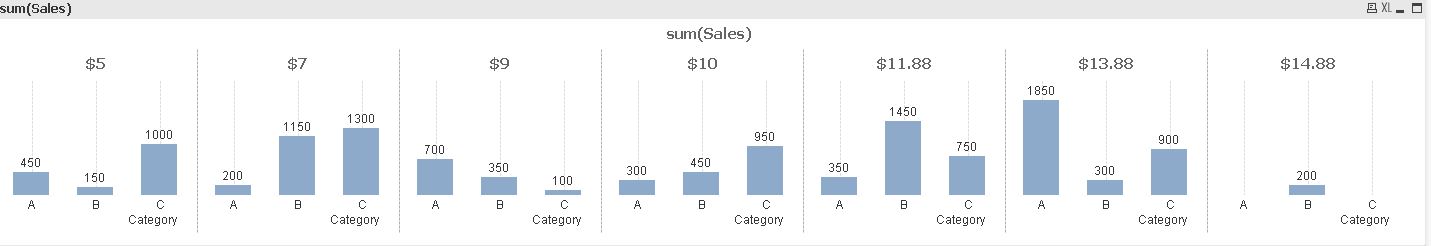
hi Below is the chart which is in Tableau.
Now I want same chart in qlikview.

Showing sales with different price points like $5,$7,$9,$11.88
this is the formula which I used in Tableau now.
if [Avgprice]>4.95 and [Avgprice]<5.05 then "$5"
elseif [Avgprice]>6.95 and [Avgprice]<7.05 then "$7"
elseif [Avgprice]>8.95 and [Avgprice]<9.05 then "$9"
elseif [Avgprice]>9.95 and [Avgprice]<10.05 then "$10"
elseif [Avgprice]>11.83 and [Avgprice]<11.93 then "$11.88"
elseif [Avgprice]>13.83 and [Avgprice]<13.93 then "$13.88"
elseif [Avgprice]>14.83 and [Avgprice]<14.93 then "$14.88"
else "Others"
END
I want same in qlikview in bar chart .
- Mark as New
- Bookmark
- Subscribe
- Mute
- Subscribe to RSS Feed
- Permalink
- Report Inappropriate Content
Did you try this, Before? If you have the data please share that. So that we can try to help, Please
- Mark as New
- Bookmark
- Subscribe
- Mute
- Subscribe to RSS Feed
- Permalink
- Report Inappropriate Content
Something like Trellis ?
Not sure.
- Mark as New
- Bookmark
- Subscribe
- Mute
- Subscribe to RSS Feed
- Permalink
- Report Inappropriate Content
seems to be , this person needs REFRENCE LINES paralle to y-axis ?
- Mark as New
- Bookmark
- Subscribe
- Mute
- Subscribe to RSS Feed
- Permalink
- Report Inappropriate Content
See Attached
If a post helps to resolve your issue, please accept it as a Solution.