Unlock a world of possibilities! Login now and discover the exclusive benefits awaiting you.
- Qlik Community
- :
- All Forums
- :
- QlikView App Dev
- :
- Prob regarding chart
- Subscribe to RSS Feed
- Mark Topic as New
- Mark Topic as Read
- Float this Topic for Current User
- Bookmark
- Subscribe
- Mute
- Printer Friendly Page
- Mark as New
- Bookmark
- Subscribe
- Mute
- Subscribe to RSS Feed
- Permalink
- Report Inappropriate Content
Prob regarding chart
Hey,
I just gone thru a dashboard and wanted to make same. I have 4 buttons for(straight table , pivot table , bar chart , line chart).
Now, I want a single chart where if i select pivot table then it show pivot table. If i select Straight table function then it should show Straight table data and so on. By default Straight table data is shown.
Note: I must have only one chart where all this data is to be show. How can i do this ??
- Tags:
- new_to_qlikview
- « Previous Replies
-
- 1
- 2
- Next Replies »
Accepted Solutions
- Mark as New
- Bookmark
- Subscribe
- Mute
- Subscribe to RSS Feed
- Permalink
- Report Inappropriate Content
Hi,
Stept 1: Directly can put in the container.
OR
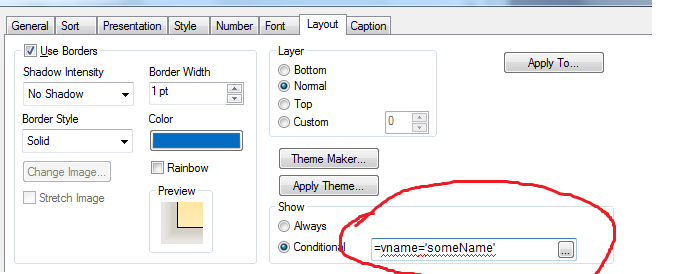
Step 2: create the 4 text objects and then connect the each text object with the each one charts by using 'set variable' in actions.
Tect Object:

Charts:
Example:
Text Object In set variable: Charts In conditional:
Text Object 1. vName, someName Straight table: =vName='someName'
Text Object 2. vName1, someName2 pivot table: =vName2= 'someName2'
Text Object 3. vName3, someName3 Straight table: =vName3='someName3'
Text Object 4. vName4, someName4 pivot table: =vName4= 'someName4'
- Mark as New
- Bookmark
- Subscribe
- Mute
- Subscribe to RSS Feed
- Permalink
- Report Inappropriate Content
Hi
have you tried fast type change in chart
- Mark as New
- Bookmark
- Subscribe
- Mute
- Subscribe to RSS Feed
- Permalink
- Report Inappropriate Content
Hey,
Actually , this is to be attained other than fast type change.
- Mark as New
- Bookmark
- Subscribe
- Mute
- Subscribe to RSS Feed
- Permalink
- Report Inappropriate Content
then create four chart based on conditional show hide the charts and display
- Mark as New
- Bookmark
- Subscribe
- Mute
- Subscribe to RSS Feed
- Permalink
- Report Inappropriate Content
Hi,
First create a variable and assign value 1.
create 4 buttons and and add triggers on each button with the below values:
button for Straight table = assign 1 to variable
button for pivot table = assign 2 to variable
button for bar chart = assign 3 to variable
button for line chart = assign 4 to variable
Use the Show condition option under Layout of each object by checking variable = * (1/2/3/4).
- Mark as New
- Bookmark
- Subscribe
- Mute
- Subscribe to RSS Feed
- Permalink
- Report Inappropriate Content
Hey thanx but i see there is single chart and for each chart i select , let say for straight table , under Show Conditional in LAyout tab, vAdhoc = 1 is written , similarly for pivot it is =2 and so on. So any other way to acheive this ?
- Mark as New
- Bookmark
- Subscribe
- Mute
- Subscribe to RSS Feed
- Permalink
- Report Inappropriate Content
u can try any of these ways,
1.container objects may help.
2, create variable and use this layout tab show conditional
if variable =1 straight table
variable =2 pivot table
variable =3 line table
variable =4 bar table
use pre-defined list box to select which ever u want.
- Mark as New
- Bookmark
- Subscribe
- Mute
- Subscribe to RSS Feed
- Permalink
- Report Inappropriate Content
Hi
The way to do this with a single chart is the built in fast change functionality. There is no button action to perform the fast change, but you may be able to do it with a macro - but why would you want to write a macro to perform something that is already built in?
Alternatively, go with the multi-chart options suggested above.
HTH
Jonathan
- Mark as New
- Bookmark
- Subscribe
- Mute
- Subscribe to RSS Feed
- Permalink
- Report Inappropriate Content
Hi,
Stept 1: Directly can put in the container.
OR
Step 2: create the 4 text objects and then connect the each text object with the each one charts by using 'set variable' in actions.
Tect Object:
Charts:
Example:
Text Object In set variable: Charts In conditional:
Text Object 1. vName, someName Straight table: =vName='someName'
Text Object 2. vName1, someName2 pivot table: =vName2= 'someName2'
Text Object 3. vName3, someName3 Straight table: =vName3='someName3'
Text Object 4. vName4, someName4 pivot table: =vName4= 'someName4'
- Mark as New
- Bookmark
- Subscribe
- Mute
- Subscribe to RSS Feed
- Permalink
- Report Inappropriate Content
HEy,
but in second case , i ahve to create 4 different charts . But i dont want to create 4 different charts.
- « Previous Replies
-
- 1
- 2
- Next Replies »