Unlock a world of possibilities! Login now and discover the exclusive benefits awaiting you.
- Qlik Community
- :
- All Forums
- :
- QlikView App Dev
- :
- Problem chart
- Subscribe to RSS Feed
- Mark Topic as New
- Mark Topic as Read
- Float this Topic for Current User
- Bookmark
- Subscribe
- Mute
- Printer Friendly Page
- Mark as New
- Bookmark
- Subscribe
- Mute
- Subscribe to RSS Feed
- Permalink
- Report Inappropriate Content
Problem chart
Hello, i have a problem to do expression on my chart
i made a graphical example of the chart i need.
as u can see i need 2 kind of line per project
- line of publication date purple
- line of planed date orange (non continuous g1,g2,g3)
X axis Version of projects (in grey dashed lines project non selected)
i really don't know how to create that chart
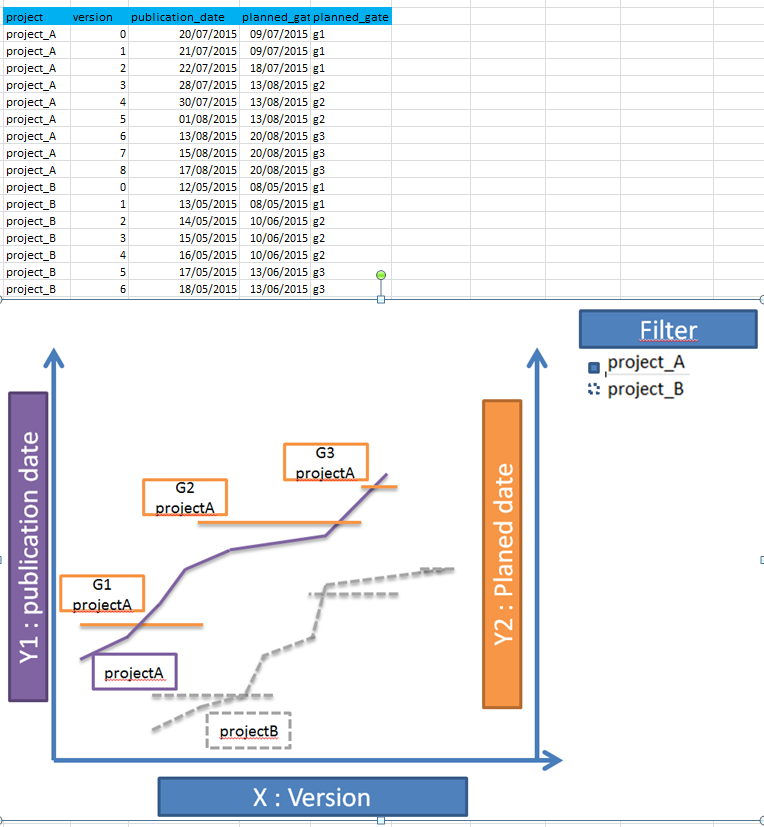
If u have some ideas  ?
?
Accepted Solutions
- Mark as New
- Bookmark
- Subscribe
- Mute
- Subscribe to RSS Feed
- Permalink
- Report Inappropriate Content
- Mark as New
- Bookmark
- Subscribe
- Mute
- Subscribe to RSS Feed
- Permalink
- Report Inappropriate Content
Can you post a source file with data?
talk is cheap, supply exceeds demand
- Mark as New
- Bookmark
- Subscribe
- Mute
- Subscribe to RSS Feed
- Permalink
- Report Inappropriate Content
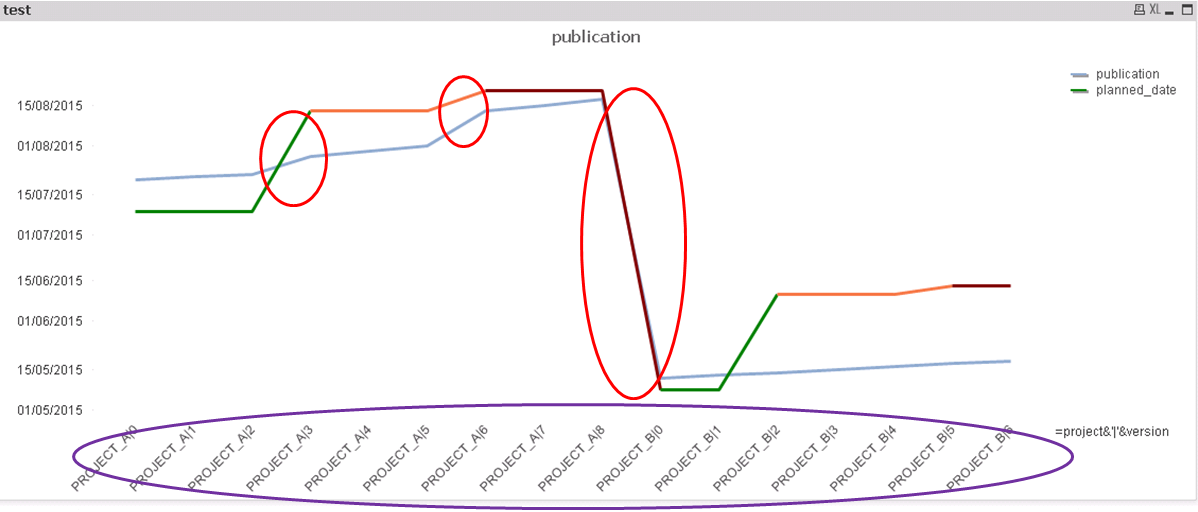
So i don't want transition in red
and i want only version in X axis in purple dont project + version but i don't how to display that.
I need project in "expression i think"
i link the file too
- Mark as New
- Bookmark
- Subscribe
- Mute
- Subscribe to RSS Feed
- Permalink
- Report Inappropriate Content
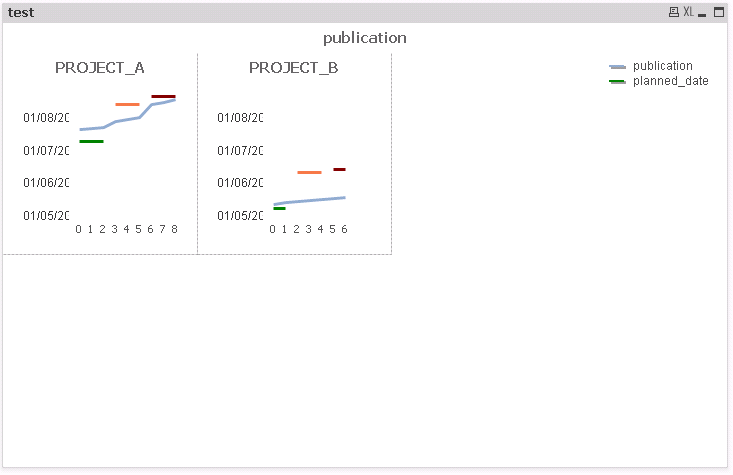
See attached qvw
talk is cheap, supply exceeds demand
- Mark as New
- Bookmark
- Subscribe
- Mute
- Subscribe to RSS Feed
- Permalink
- Report Inappropriate Content
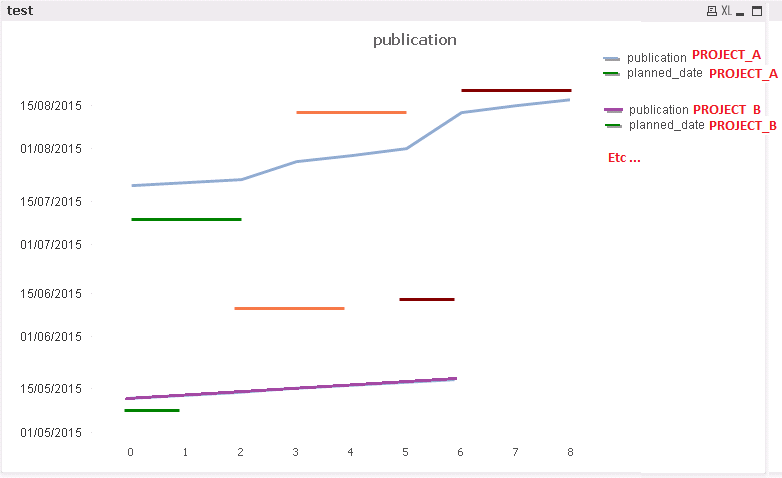
Nice !!! but i meant somethink like this that the hard part i think
- Mark as New
- Bookmark
- Subscribe
- Mute
- Subscribe to RSS Feed
- Permalink
- Report Inappropriate Content
Qlikview Tips and Tricks By Adam Davies
give me that almost what i need but size is too small .... but it's realy COOL Thank u very much Gysbert Wassenaar