Unlock a world of possibilities! Login now and discover the exclusive benefits awaiting you.
- Qlik Community
- :
- All Forums
- :
- QlikView App Dev
- :
- Problem in calculate value
- Subscribe to RSS Feed
- Mark Topic as New
- Mark Topic as Read
- Float this Topic for Current User
- Bookmark
- Subscribe
- Mute
- Printer Friendly Page
- Mark as New
- Bookmark
- Subscribe
- Mute
- Subscribe to RSS Feed
- Permalink
- Report Inappropriate Content
Problem in calculate value
dear,
I have two table with this fields
ItemID | ItemTitle
1 | IT1
2 | IT2
3 | IT3
4 | IT4
5 | IT5
.....
CustomerName | Item Title | Quantity
C1 | IT1 | 5
C2 | IT2 | 4
C1 | IT1 | 6
C1 | IT2 | 7
C3 | IT1 | 3
C2 | IT2 | 2
............
.........
..........
when i select a customer i want display bellow values:
ItemTitle | TotalQuantity for all Customer | Total Quantity of Top(10) of customer buy more | Total Quantity of selected customer
- Mark as New
- Bookmark
- Subscribe
- Mute
- Subscribe to RSS Feed
- Permalink
- Report Inappropriate Content
Hi,
You are not stating an issue, you are asking us how to do a standard visualization? How far did you get with your data model and visualizations before coming to the forum?
- Mark as New
- Bookmark
- Subscribe
- Mute
- Subscribe to RSS Feed
- Permalink
- Report Inappropriate Content
My problem is that i can't calculate top(10) Quantity of best buying customers.
- Mark as New
- Bookmark
- Subscribe
- Mute
- Subscribe to RSS Feed
- Permalink
- Report Inappropriate Content
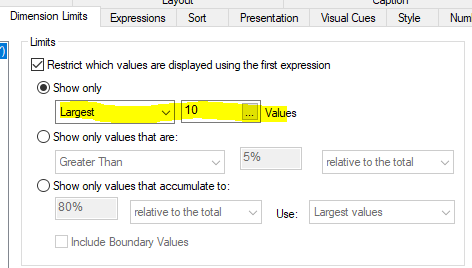
You can restrict in Dimensions limit to show top 10 best buying customers.
- Mark as New
- Bookmark
- Subscribe
- Mute
- Subscribe to RSS Feed
- Permalink
- Report Inappropriate Content
Just try the below 3 expression
TotalQuantity for all Customer = Sum (total<customer> Amount)
Total Quantity of Top(10) of customer buy more = Sum ({<customer={"=Rank(sum(amount)<=10)"}>} Amount)
Total Quantity of selected customer = Sum ( Amount)