Unlock a world of possibilities! Login now and discover the exclusive benefits awaiting you.
- Qlik Community
- :
- All Forums
- :
- QlikView App Dev
- :
- Problem with Aggr() function
- Subscribe to RSS Feed
- Mark Topic as New
- Mark Topic as Read
- Float this Topic for Current User
- Bookmark
- Subscribe
- Mute
- Printer Friendly Page
- Mark as New
- Bookmark
- Subscribe
- Mute
- Subscribe to RSS Feed
- Permalink
- Report Inappropriate Content
Problem with Aggr() function
Hi
I've 3 dimensions(i.e as shown in below image) and 1 exp as =Count(Aggr(Sum(Lenskey),DefectName)).
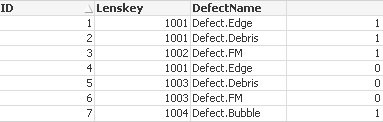
- In defecname colomn you can see different string names. Now, I want to display in the expression as per count of defectname values
For eg:
In the above table you can see in DefectName column two Defect.Edge values so i want plot in the expression part as 2 for dat particular value Defect.Edge whereever i see. Right now the above tables has Defect.Edge value for Lenskey 1001.
Same for Debris,FM,Bubble as per there own count.
- Mark as New
- Bookmark
- Subscribe
- Mute
- Subscribe to RSS Feed
- Permalink
- Report Inappropriate Content
Hi Jacq,
I am not 100% if I got your requirement correctly, but I think the expression could look like
=count(total<DefectName> Lenskey)
Your above statement has two issues in my opinion:
- First, you probably need a NODISTINCT qualifier to get results for multiple occurences of your DefectName Values, that's why some rows show zeros. So try a
=count(aggr( NODISTINCT sum(Lenskey), DefectName))
This should show you 1 for all rows. But why 1's?
- This is due to the fact that you first sum the Lenskey values per DefectName, resulting in e.g. 2002 for Edge, counting that value in your outer aggregation is always 1 (Note that DefectName is limited to chart dimensions), you only get one DefectName on that aggregation level.
To get around this, you probably could use
=sum( aggr( NODISTINCT count(Lenskey), DefectName))
so first count the Keys per DefectName, then sum. But this is more complex than my above initial suggestion and the total rows will be different.
But it always depend what you want to achieve, and this I haven't understood completely.
Hope this helps,
Stefan
- Mark as New
- Bookmark
- Subscribe
- Mute
- Subscribe to RSS Feed
- Permalink
- Report Inappropriate Content
Thanks a lot swuehl i'll work out and get back to u